photo free
Home Images Vectors Videos

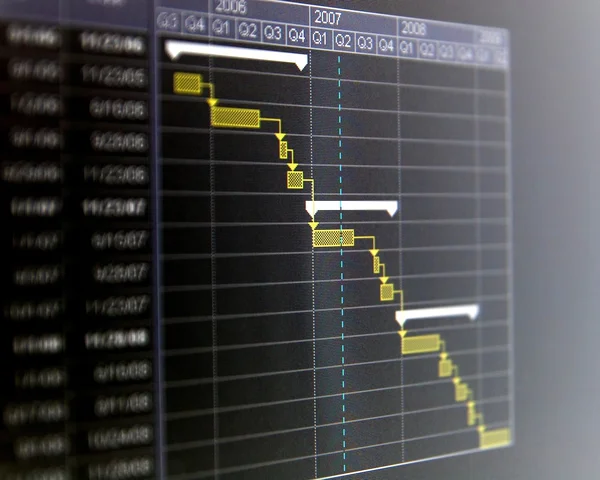
Stock image A Gantt chart is a type of bar chart that illustrates a project schedule.
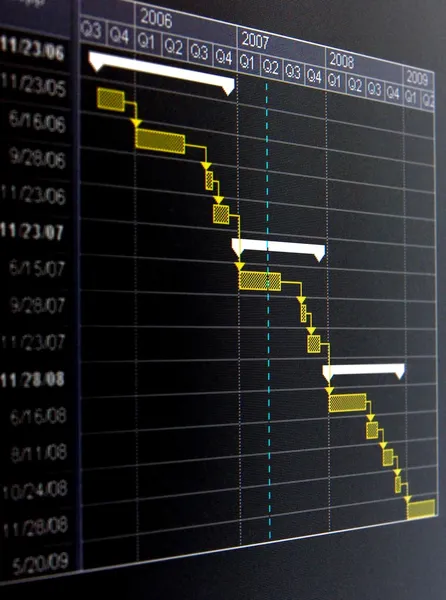
Stock image A Gantt chart is a type of bar chart that illustrates a project schedule.
Published: Jan.30, 2014 08:02:00
Author: fbatista72
Views: 145
Downloads: 8
File type: image / jpg
File size: 1.78 MB
Orginal size: 2356 x 3163 px
Available sizes:
S
(372 x 500)
M
(745 x 1000)
L
(1490 x 2000)
XL
(2356 x 3163)
EL0
(2356 x 3163)
Level: silver
Download Image
Image topics:

Similar stock images

stock image A Gantt chart is a type of bar chart that illustrates a project schedule.

A Gantt Chart Is A Type Of Bar Chart That Illustrates A Project Schedule.

3237 × 2592
stock image Financial graphics loupe and pencils

Financial Graphics Loupe And Pencils

6000 × 4000
stock image Analysis of statistics

Analysis Of Statistics

3008 × 2000
stock image Monitor with stock data, closeup. Financial trading concept

Monitor With Stock Data, Closeup. Financial Trading Concept

5340 × 3840
stock image Financing schedule

Financing Schedule

5476 × 3651
stock image Economy

Economy

2848 × 4272
stock image Financial business.Background

Financial Business.Background

4000 × 3000
stock image Financial graph

Financial Graph

3595 × 2397