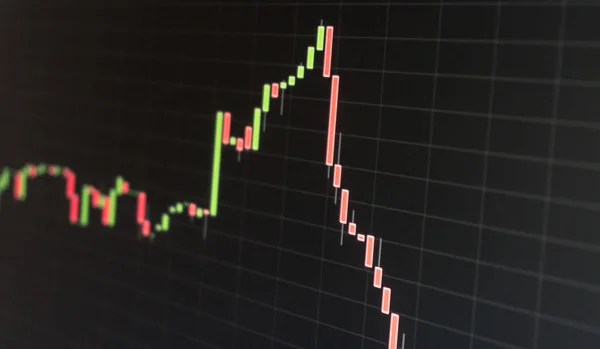
Stock image A stock market candlestick chart showing a sharply declining and crashing price going deep into the red
Published: Apr.17, 2019 09:14:16
Author: makasanaphoto
Views: 182
Downloads: 2
File type: image / jpg
File size: 11.64 MB
Orginal size: 5662 x 3780 px
Available sizes:
Level: bronze
Similar stock images
A Stock Market Candlestick Chart Showing A Sharply Declining And Crashing Price Going Deep Into The Red
3699 × 5284