photo free
Home Images Vectors Videos

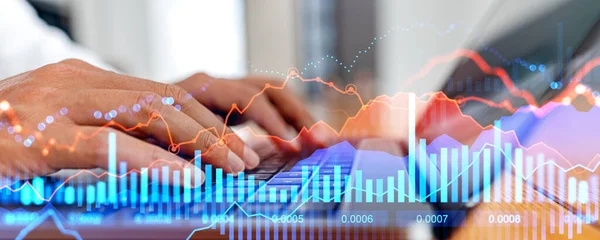
Stock image African Advisor Using KPI Dashboard With Financial Analytics Graphs

Stock image African Advisor Using KPI Dashboard With Financial Analytics Graphs
Published: Aug.13, 2021 12:00:26
Author: AndreyPopov
Views: 1
Downloads: 0
File type: image / jpg
File size: 10.09 MB
Orginal size: 9446 x 3149 px
Available sizes:
S
(500 x 167)
M
(1000 x 333)
L
(2000 x 667)
XL
(9446 x 3149)
EL0
(9446 x 3149)
Level: platinum
Download Image
Image topics:

Similar stock images

stock image KPI Dashboard Data Analytics On Business Laptop

KPI Dashboard Data Analytics On Business Laptop

8069 × 2811
stock image African Businessman Using Analytics Data KPI Dashboard Tech

African Businessman Using Analytics Data KPI Dashboard Tech

9504 × 3168
stock image Advisor Using Smartphone With Data Dashboard Analytics

Advisor Using Smartphone With Data Dashboard Analytics

9405 × 6270
stock image African Advisor Using KPI Dashboard With Financial Analytics Graphs

African Advisor Using KPI Dashboard With Financial Analytics Graphs

9130 × 3043
stock image Businessman hands typing on laptop keyboard, closeup. Double exposure with forex diagrams, lines and numbers chart. Concept of online trading, market and economy

Businessman Hands Typing On Laptop Keyboard, Closeup. Double Exposure With Forex Diagrams, Lines And Numbers Chart. Concept Of Online Trading, Market And Economy

7500 × 3000
stock image Investor man analyzing the graph of the stock market using a pen pointing to the computer screen.

Investor Man Analyzing The Graph Of The Stock Market Using A Pen Pointing To The Computer Screen.

6000 × 4000
stock image Double exposure of man's hands holding and using a phone and financial chart drawing. Market analysis concept.

Double Exposure Of Man's Hands Holding And Using A Phone And Financial Chart Drawing. Market Analysis Concept.

4500 × 3000
stock image Two business people working together on stock market strategy. Try to analyze forex behavior. Financial graph hologram. Double exposure.

Two Business People Working Together On Stock Market Strategy. Try To Analyze Forex Behavior. Financial Graph Hologram. Double Exposure.

6000 × 4000