Home
Images
Vectors
Videos
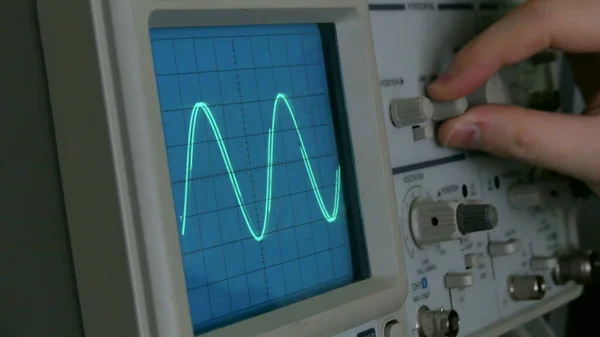
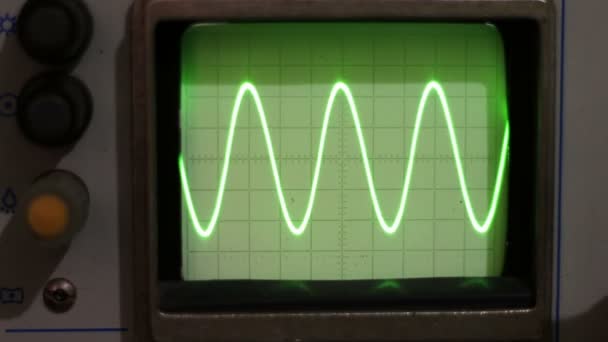
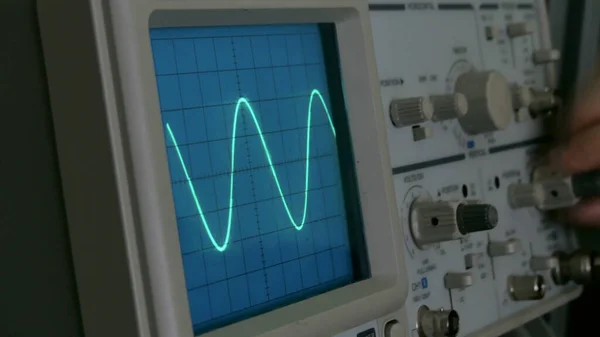
Stock image Amplitude Diagram on the oscilloscope. A man presses the buttons on the device. The geometric line changes shape
Published:
Nov.03, 2020 08:40:07
Author:
vital9c
Views:
0
Downloads:
0
File type:
image
/
jpg
File size:
0.61 MB
Orginal size:
3840
x
2160
px
Available sizes:
S
(500 x 281)
M
(1000 x 563)
L
(2000 x 1125)
XL
(3840 x 2160)
EL0
(3840 x 2160)
Level:
beginner
Download Image
Image topics:
Image
Curve
Graphic
Equipment
Sign
Electricity
Power
Technology
Line
Wave
Hand
Symbol
Button
Display
Electronic
Digital
Monitor
Measuring
Pulse
Test
Radio
Frequency
Grid
Experiment
Lab
Laboratory
Science
Peak
Engineering
Analyzing
Analog
Control
Engineer
Research
Spectrum
Analysis
Graph
Chart
Scientific
Diagram
Probe
Earthquake
Amplitude
Vibration
Waveform
Oscilloscope
Seismic
Seismograph
4k
Similar stock images
Amplitude Diagram On The Oscilloscope. A Man Presses The Buttons On The Device. The Geometric Line Changes Shape
3840 × 2160
Amplitude Diagram On The Oscilloscope. A Man Presses The Buttons On The Device. The Geometric Line Changes Shape
3840 × 2160
Amplitude Diagram On The Oscilloscope. A Man Presses The Buttons On The Device. The Geometric Line Changes Shape
3840 × 2160
Hand Push Buttons And Rotates Knob On Oscilloscope For Old Video Repair
1920 × 1080
Amplitude Diagram On The Oscilloscope. A Man Presses The Buttons On The Device. The Geometric Line Changes Shape
3840 × 2160
Curve Moves On Display Of Oscilloscope, Some Buttons On Edge Of Screen
1920 × 1080
Adjusting Signal Oscilloscope
1920 × 1080
Old Oscilloscope
1920 × 1080