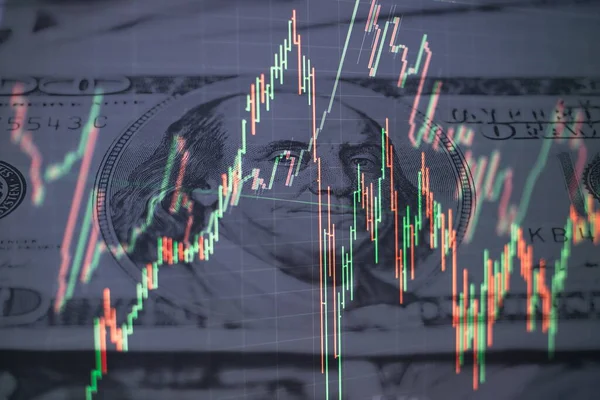
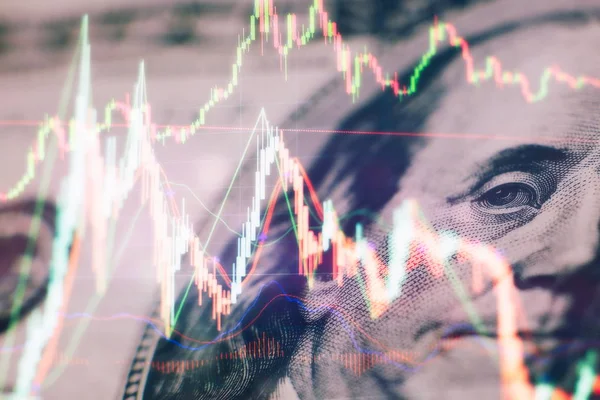
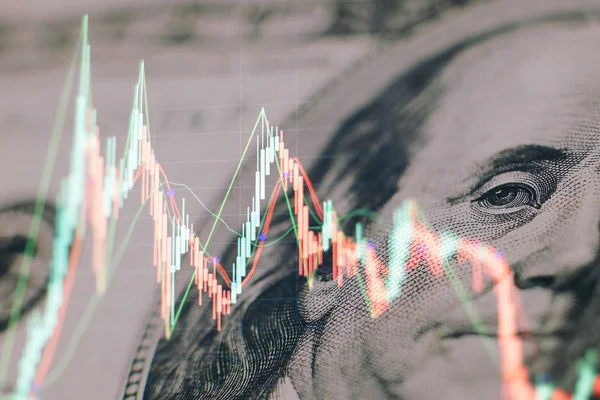
Stock image analyzing in trading market. Working set for analyzing financial statistics and analyzing a market data. Data analyzing from charts and graph to find out the result.
Published: Jan.27, 2020 08:42:12
Author: Maximusdn
Views: 8
Downloads: 2
File type: image / jpg
File size: 5.59 MB
Orginal size: 5315 x 3543 px
Available sizes:
Level: bronze
Similar stock images


Candle Stick Graph Chart Of Stock Market Investment Trading, Stock Exchange Concept Design And Background.
5315 × 3543