photo free
Home Images Vectors Videos

Stock image Bearish downtrend candlestick pattern on stock market trading chart with indicators
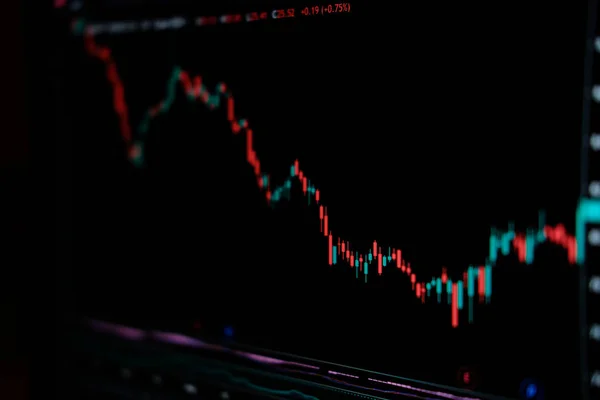
Stock image Bearish downtrend candlestick pattern on stock market trading chart with indicators
Published: Sep.09, 2019 09:18:42
Author: JulianJD
Views: 35
Downloads: 3
File type: image / jpg
File size: 3.74 MB
Orginal size: 6000 x 4000 px
Available sizes:
S
(500 x 333)
M
(1000 x 667)
L
(2000 x 1333)
XL
(6000 x 4000)
EL0
(6000 x 4000)
Level: beginner
Download Image
Image topics:

Similar stock images

stock image Abstract background with technology business

Abstract Background With Technology Business

9803 × 4488
stock image The Forex graph chart on the digital screen. Working set for analyzing financial statistics and analyzing a market data.

The Forex Graph Chart On The Digital Screen. Working Set For Analyzing Financial Statistics And Analyzing A Market Data.

5315 × 3543
stock image Droping Candle stick graph chart of stock market investment trading. Finance background data graph. Online forex data. Professional market analysis.

Droping Candle Stick Graph Chart Of Stock Market Investment Trading. Finance Background Data Graph. Online Forex Data. Professional Market Analysis.

5705 × 3803
stock video Close up of an artist painting with water colors

Close Up Of An Artist Painting With Water Colors

4096 × 2160
stock image Financial chart, stock analysis data on digital screen. Cryptocurrency growth charts. Blur and selective focus

Financial Chart, Stock Analysis Data On Digital Screen. Cryptocurrency Growth Charts. Blur And Selective Focus

5587 × 3725
stock image The Forex graph chart on the digital screen. Working set for analyzing financial statistics and analyzing a market data.

The Forex Graph Chart On The Digital Screen. Working Set For Analyzing Financial Statistics And Analyzing A Market Data.

5472 × 3648
stock image Data analyzing from charts and graph to find out the result in trading market. Working set for analyzing financial statistics and analyzing a market data.

Data Analyzing From Charts And Graph To Find Out The Result In Trading Market. Working Set For Analyzing Financial Statistics And Analyzing A Market Data.

5472 × 3648
stock image Candle stick graph chart with indicator showing bullish point, up trend of price of stock market or stock exchange, investment and financial concept

Candle Stick Graph Chart With Indicator Showing Bullish Point, Up Trend Of Price Of Stock Market Or Stock Exchange, Investment And Financial Concept

6720 × 4480