photo free
Home Images Vectors Videos

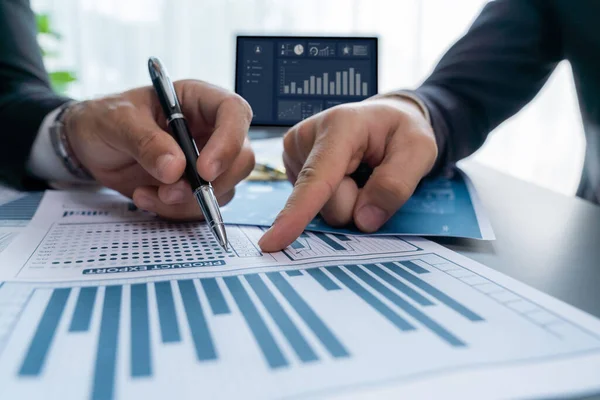
Stock image business documents on office table with graph financial diagram

Stock image business documents on office table with graph financial diagram
Published: Jul.10, 2017 12:35:47
Author: freedomtumz
Views: 6
Downloads: 0
File type: image / jpg
File size: 6.16 MB
Orginal size: 4718 x 3145 px
Available sizes:
S
(500 x 333)
M
(1000 x 667)
L
(2000 x 1333)
XL
(4718 x 3145)
EL0
(4718 x 3145)
Level: silver
Download Image
Image topics:

Similar stock images

stock image business documents on office table with graph financial diagram

Business Documents On Office Table With Graph Financial Diagram

4718 × 3145
stock image businessman working plan the business and analysis many chart gr

Businessman Working Plan The Business And Analysis Many Chart Gr

4718 × 3145
stock image Handsome young man working with touchpad while sitting on the co

Handsome Young Man Working With Touchpad While Sitting On The Co

4896 × 3264
stock image Startup asian business teamwork analyse investment marketing data and use calculator ,finance meeting.

Startup Asian Business Teamwork Analyse Investment Marketing Data And Use Calculator ,finance Meeting.

6240 × 4160
stock image Closeup busy analyst team discussing financial data on digital dashboard, analyzing chart and graph using data science software display on a laptop screen. Business intelligence and Fintech. Fervent

Closeup Busy Analyst Team Discussing Financial Data On Digital Dashboard, Analyzing Chart And Graph Using Data Science Software Display On A Laptop Screen. Business Intelligence And Fintech. Fervent

7952 × 5304
stock image marketing chart on the desktop. business background

Marketing Chart On The Desktop. Business Background

4715 × 2263
stock image Closeup busy analyst team discussing financial data on digital dashboard, analyzing chart and graph using data science software display on a laptop screen. Business intelligence and Fintech. Fervent

Closeup Busy Analyst Team Discussing Financial Data On Digital Dashboard, Analyzing Chart And Graph Using Data Science Software Display On A Laptop Screen. Business Intelligence And Fintech. Fervent

7952 × 5304