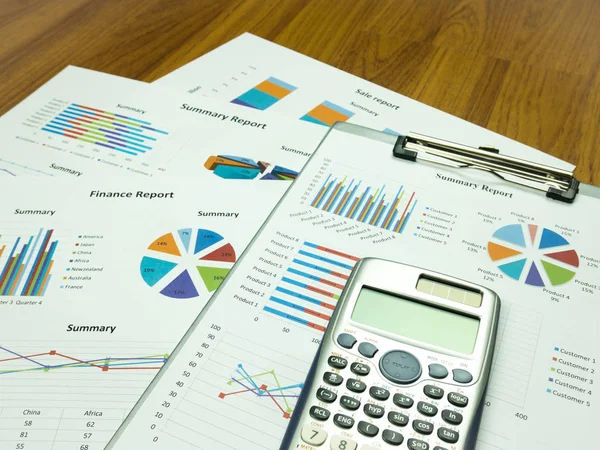
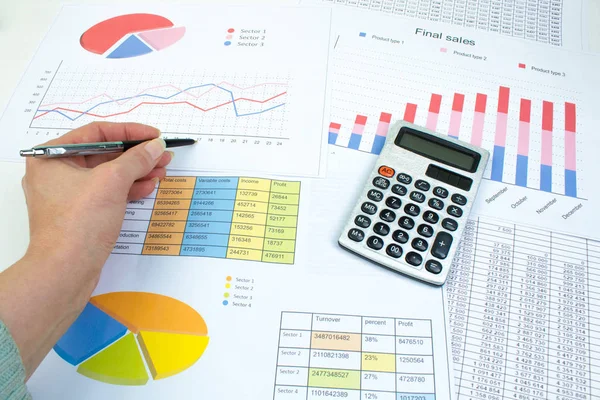
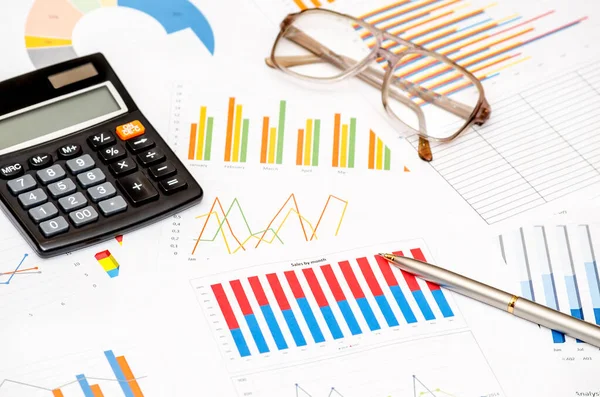
Stock image Business report chart and Financial graph analysis with pen and calculator on table.

Published: Nov.21, 2018 11:33:30
Author: Amankris
Views: 2
Downloads: 1
File type: image / jpg
File size: 7.57 MB
Orginal size: 4479 x 3363 px
Available sizes:
Level: beginner