Home
Images
Vectors
Videos
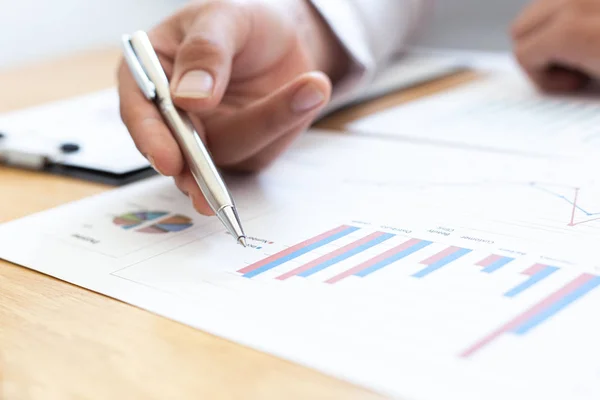
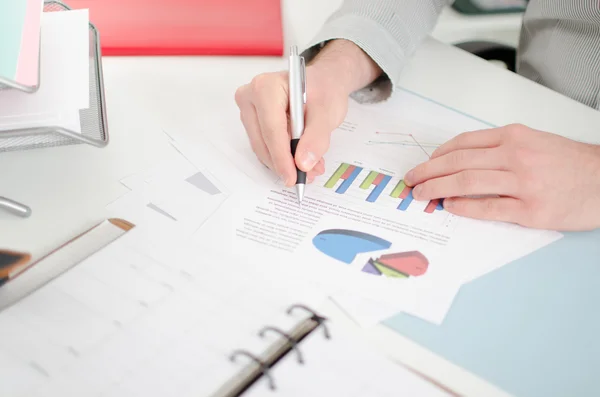
Stock image Businessmen use graphs to summarize results and calculate income-expenses to find financial balance points and use them to improve and advance business, finance and economic concepts.
Published:
Jul.21, 2023 08:30:31
Author:
Tapanakornkaow@gmail.com
Views:
1
Downloads:
0
File type:
image
/
jpg
File size:
8.13 MB
Orginal size:
5472
x
3648
px
Available sizes:
S
(500 x 333)
M
(1000 x 667)
L
(2000 x 1333)
XL
(5472 x 3648)
EL0
(5472 x 3648)
Level:
bronze
Download Image
Image topics:
Money
Closeup
Business
Financial
Person
Success
Technology
Hand
Concept
Corporate
Office
Home
Working
Laptop
Data
Development
Professional
Lifestyle
Work
Businessman
Pen
Document
Desk
Planning
Balance
Investment
Savings
Tax
Budget
Finance
Payment
Economy
Marketing
Report
Earnings
Workplace
Calculator
Account
Analysis
Graph
Management
Income
Paperwork
Bureaucracy
Statistics
Accounting
Calculate
Accountant
Expenses
Counting
Similar stock images
Businessman Working On Financial Results
6016 × 4016
Businessmen Use Graphs To Summarize Results And Calculate Income-expenses To Find Financial Balance Points And Use Them To Improve And Advance Business, Finance And Economic Concepts.
5472 × 3648
Businessmen Use Calculators To Calculate The Cost Of Real Estate Investments To Prepare For Offering To Customers Who Want To Share Shares With The Company, Business Financ Concept
5472 × 3648
Businessmen Use Graphs To Summarize Results And Calculate Income-expenses To Find Financial Balance Points And Use Them To Improve And Advance Business, Finance And Economic Concepts.
5472 × 3648
Business Team Data Analyzing Income Charts Document During Discussion Explain Strategy Meeting. On Start-up Project Teamwork Together
4896 × 3264
Businessman Analyzing Graphs
4928 × 3264
Start The Business By Studying And Calculating Historical Investment Data.
4608 × 3072
Financial And Investment Planning, Head Of Marketing Is Analyzin
5472 × 3648