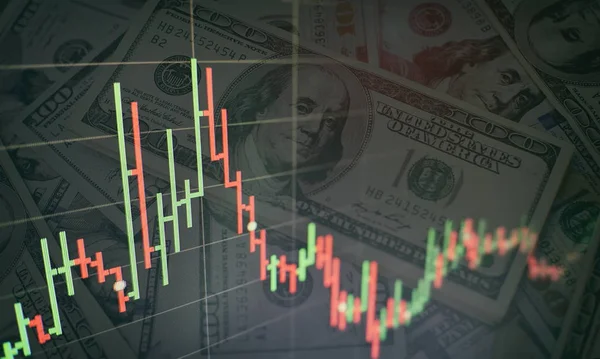
Stock image Candle stick graph chart of stock market investment trading, Stock exchange concept design and background.

Published: Jun.03, 2019 13:48:03
Author: Maximusdn
Views: 2
Downloads: 0
File type: image / jpg
File size: 7.46 MB
Orginal size: 5315 x 3543 px
Available sizes:
Level: bronze
Similar stock images

Candle Stick Graph Chart Of Stock Market Investment Trading, Stock Exchange Concept Design And Background.
5315 × 3543

Candle Stick Graph Chart Of Stock Market Investment Trading, Stock Exchange Concept Design And Background.
5315 × 3543