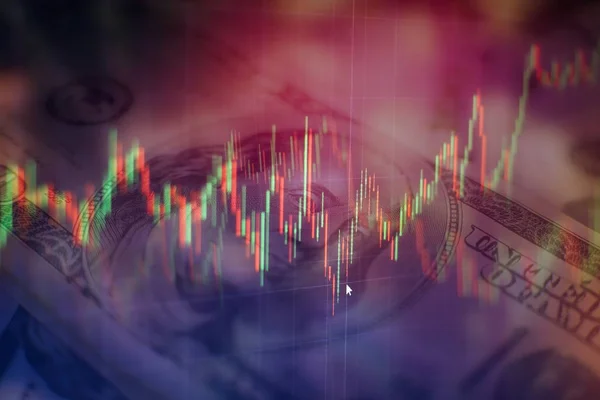
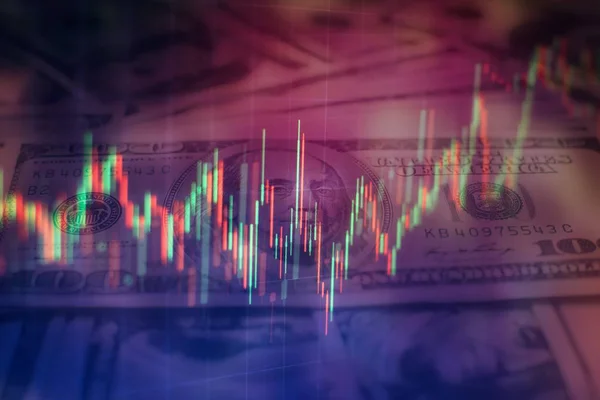
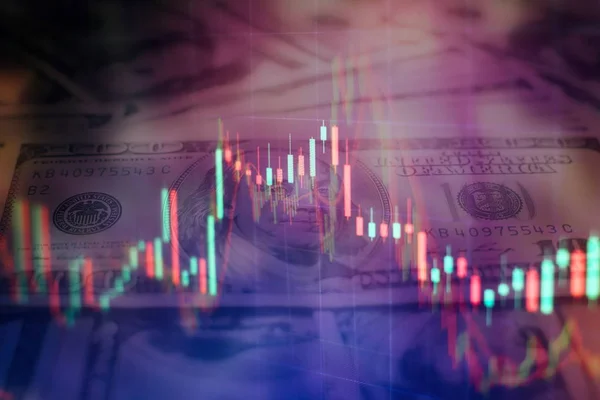
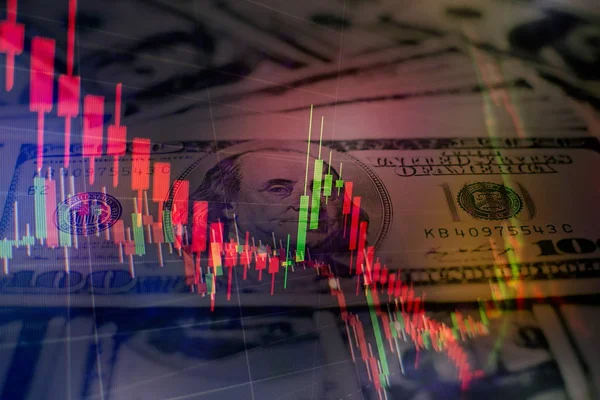
Stock image Candle stick graph chart of stock market investment trading. The Forex graph chart on the digital screen.
Published: Aug.19, 2019 12:20:21
Author: Maximusdn
Views: 7
Downloads: 0
File type: image / jpg
File size: 2.35 MB
Orginal size: 3543 x 2362 px
Available sizes:
Level: bronze
Similar stock images
Financial Data On A Monitor Which Including Of Market Analyze. Bar Graphs, Diagrams, Financial Figures.
3543 × 2362
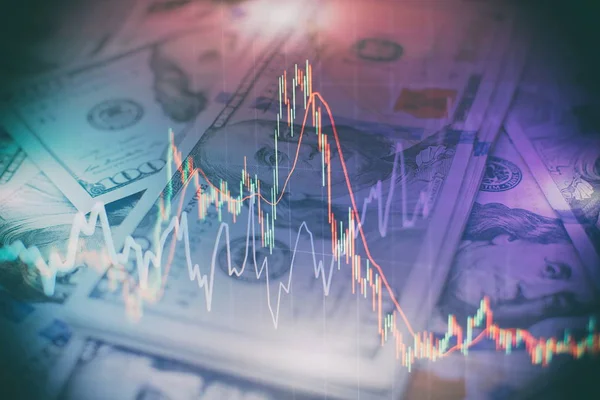


Financial Data On A Monitor Which Including Of Market Analyze. Bar Graphs, Diagrams, Financial Figures.
3543 × 2362