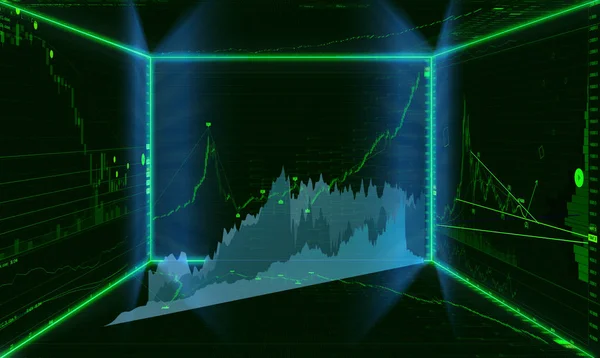
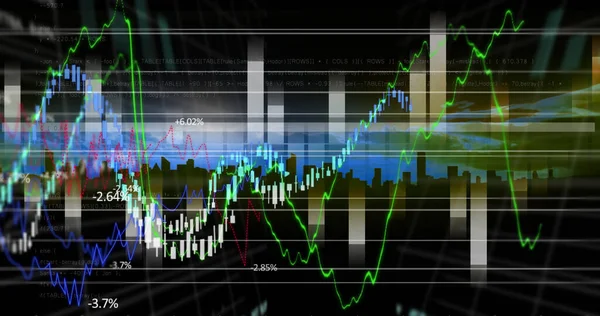
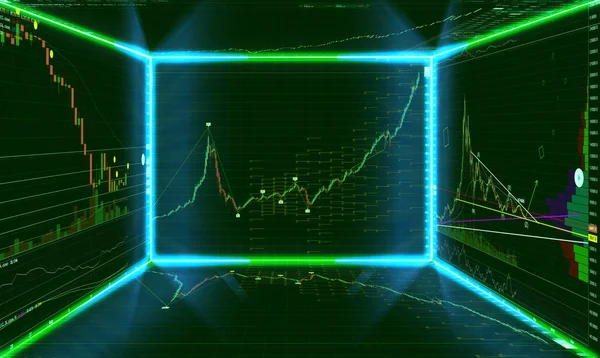
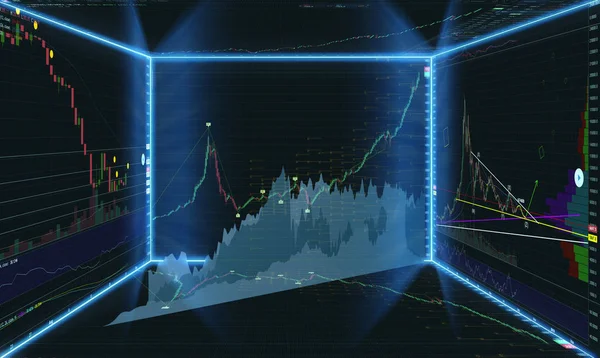
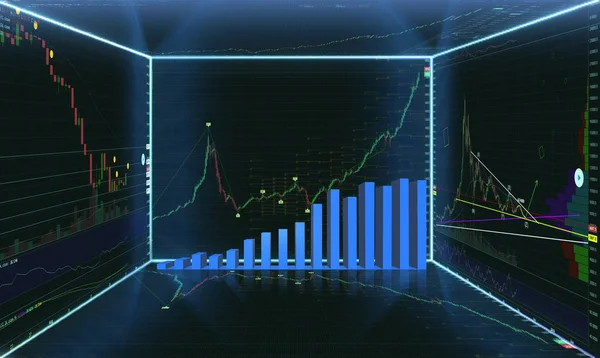
Stock image Candle stick graph chart of stock market investment trading with digital information screen
Published: Dec.29, 2018 07:02:51
Author: MikeMareen
Views: 52
Downloads: 3
File type: image / jpg
File size: 40.88 MB
Orginal size: 9896 x 5922 px
Available sizes:
Level: bronze
Similar stock images
Candle Stick Graph Chart Of Stock Market Investment Trading With Digital Information Screen
9896 × 5922
Candle Stick Graph Chart Of Stock Market Investment Trading With Digital Information Screen
9896 × 5922