photo free
Home Images Vectors Videos

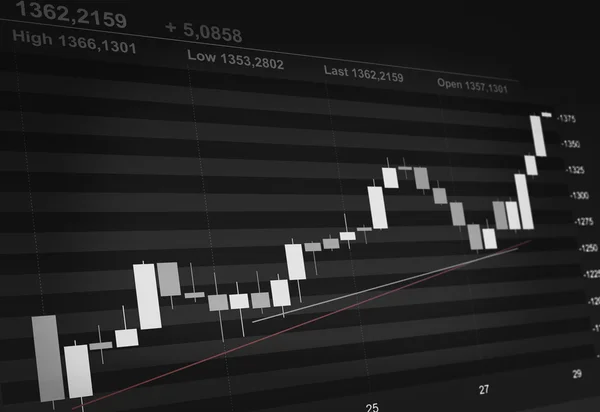
Stock image Candle stock chart

Stock image Candle stock chart
Published: Jul.09, 2012 11:22:07
Author: spaxiax
Views: 428
Downloads: 12
File type: image / jpg
File size: 3.1 MB
Orginal size: 6192 x 4254 px
Available sizes:
S
(500 x 344)
M
(1000 x 687)
L
(2000 x 1374)
XL
(6192 x 4254)
EL0
(6192 x 4254)
Level: silver
Download Image
Image topics:

Similar stock images

stock image candle stock chart

Candle Stock Chart

6192 × 4254
stock vector Stock market candlestick chart vector illustration. Buy and sell indicators for trade on the chart. Financial diagram with assets values moving up and down.

Stock Market Candlestick Chart Vector Illustration. Buy And Sell Indicators For Trade On The Chart. Financial Diagram With Assets Values Moving Up And Down.

5500 × 3234
stock image Stock japanese candles chart

Stock Japanese Candles Chart

5184 × 3456
stock image Close-up view of computer data graph with ups and downs.

Close-up View Of Computer Data Graph With Ups And Downs.

5472 × 3648
stock image ing equity chart, financial report. Red candle stick chart moves down. Business graph, stock market crash, financial figures, crisis and economic depression.

Ing Equity Chart, Financial Report. Red Candle Stick Chart Moves Down. Business Graph, Stock Market Crash, Financial Figures, Crisis And Economic Depression.

6000 × 4000
stock image Growing up stock market graph. Bull market.

Growing Up Stock Market Graph. Bull Market.

5168 × 3448
stock image Candlestick chart showing market trading conditions on blue background.

Candlestick Chart Showing Market Trading Conditions On Blue Background.

6000 × 4000
stock image Forex trading

Forex Trading

3000 × 2000