Home
Images
Vectors
Videos
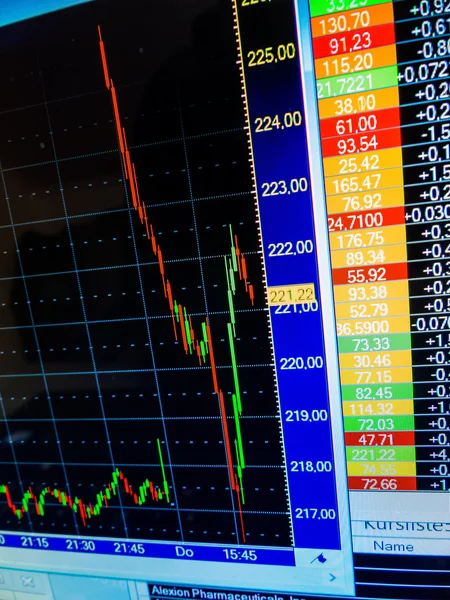
Stock image Candle technical chart of a financial instrument on a computer monitor, ready for trading
Published:
Mar.20, 2020 16:22:05
Author:
okfotopuntoit
Views:
30
Downloads:
1
File type:
image
/
jpg
File size:
5.97 MB
Orginal size:
4000
x
3108
px
Available sizes:
S
(500 x 389)
M
(1000 x 777)
L
(2000 x 1554)
XL
(4000 x 3108)
EL0
(4000 x 3108)
Level:
beginner
Download Image
Image topics:
Numbers
Bar
Computer
Money
Business
Financial
Market
Display
Screen
Monitor
Data
Internet
Equity
Exchange
Investment
Finance
Stock
Figures
Online
Prices
Earnings
Index
Graph
Chart
Investing
Platform
Trade
Bond
Funds
Ticker
Displayed
Similar stock images
Sharply Falling Price Of The Shares On The Stock Exchange
3000 × 4000
Charts Of Financial Instruments On The Monitor Of A Computer.
6016 × 4016
Charts Of Financial Instruments On The Monitor Of A Computer.
4000 × 3000
Professional Financial Histogram Chart
3738 × 2804
Stock Market Chart On LED Display
5172 × 4512
Graph Of Stock Market Data And Financial With Stock Analysis Indicator. Candle Stick Graph Chart Of Stock Market ,stock Market Data Graph Chart On LED Display Concept.
5079 × 3456