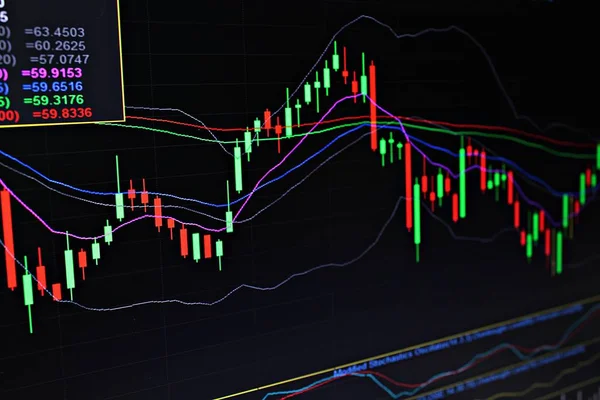
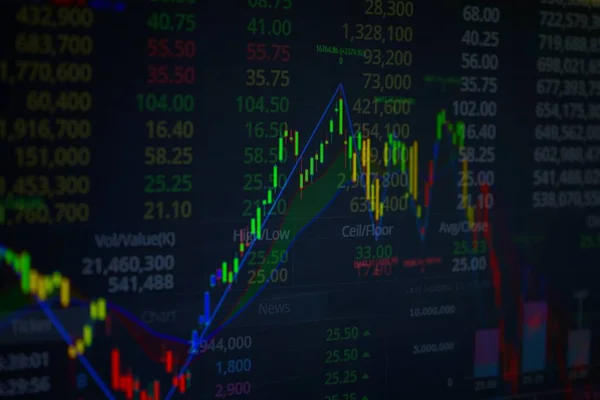
Stock image Candlestick chart from stock market on screen
Published: Sep.06, 2019 12:53:37
Author: nestampak
Views: 2
Downloads: 3
File type: image / jpg
File size: 4.88 MB
Orginal size: 6000 x 4000 px
Available sizes:
Level: beginner
Similar stock images

Market Analyze. Bar Graphs, Diagrams, Financial Figures. Forex Chart. - Finance Data Concept.
8268 × 4724

Stock Market Loss Trading Chart Investment Analysis Business Index Chart Finance Board Chart
6000 × 4000