Home
Images
Vectors
Videos
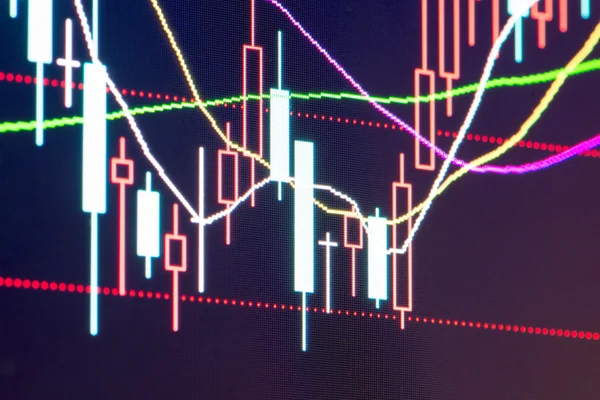
Stock image candlestick graph chart of stock market investment trading on blue background. Digital illustration
Published:
Oct.25, 2021 06:30:36
Author:
Firnthirith
Views:
1
Downloads:
1
File type:
image
/
jpg
File size:
3.52 MB
Orginal size:
5300
x
3276
px
Available sizes:
S
(500 x 309)
M
(1000 x 618)
L
(2000 x 1236)
XL
(5300 x 3276)
EL0
(5300 x 3276)
Level:
beginner
Download Image
Image topics:
Bar
Money
Backgrounds
Graphic
Illustration
Business
Market
Trading
Growth
Up
Concept
Price
Candle
Screen
Data
Glowing
Banking
Currency
Exchange
Investment
Finance
Stock
Economy
Analyzing
Earnings
Technical
Index
Analysis
Graph
Management
Chart
Raise
Candlestick
Commodity
Accounting
Profit
Diagram
Calculation
Increase
Fund
Database
Statistic
Trend
Forex
No People
Similar stock images
Stock Market Or Forex Trading Chart With Indicator In Graphic Design Concept, Vector Illustration
8000 × 5003
Digital Stock Market Trading Background.
7866 × 5556
Graph Chart Of Stock Market Investment Trading
5472 × 3648
Stock Market Or Forex Trading Graph In Futuristic Concept Suitable For Financial Investment Or Economic Trends Business Idea And All Art Work Design. Abstract Finance Background
4608 × 3072
Business Candlestick Stock Chart On Dark Background. Stock Investment Trading. Up Trend Concept.
5036 × 3526
Forex Market Charts On A Computer Display. Business Analysis Chart. Stick Candlestick Chart. Stock Price Candlestick Chart. The Concept Of Fundamental And Technical Analysis. Bars On The Price Chart.
5000 × 3399
Business Candle Stick Graph Chart Of Stock Market Investment Trading On White Background Design. Bullish Point, Trend Of Graph. Vector Illustration
6418 × 3901
Business Stats Screen
7360 × 4912