photo free
Home Images Vectors Videos

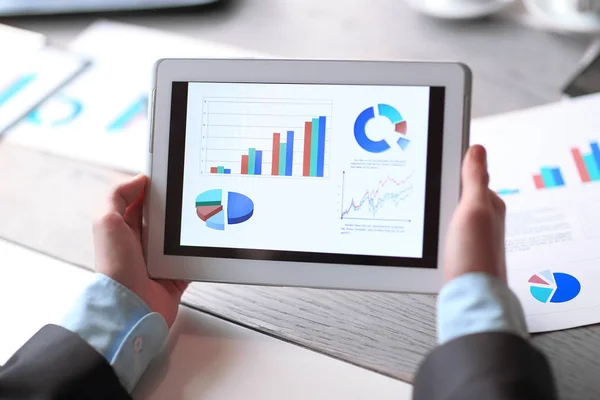
Stock image close up.financial report on the digital tablet screen.
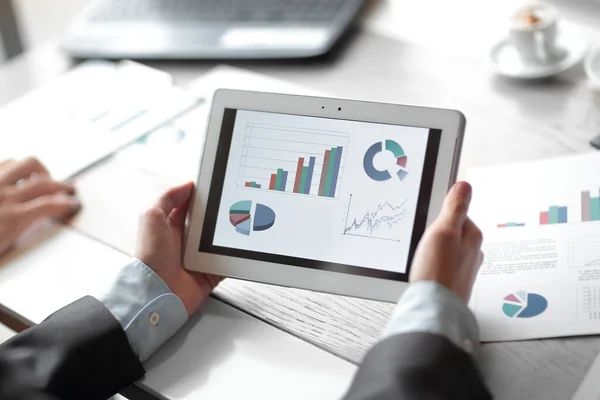
Stock image close up.financial report on the digital tablet screen.
Published: Feb.25, 2019 09:31:16
Author: albertyurolaits
Views: 2
Downloads: 0
File type: image / jpg
File size: 6.59 MB
Orginal size: 5472 x 3648 px
Available sizes:
S
(500 x 333)
M
(1000 x 667)
L
(2000 x 1333)
XL
(5472 x 3648)
EL0
(5472 x 3648)
Level: silver
Download Image
Image topics:

Similar stock images

stock image business managers crew working with startup

Business Managers Crew Working With Startup

4896 × 2754
stock image close up.financial report on the digital tablet screen.

Close Up.financial Report On The Digital Tablet Screen.

5472 × 3648
stock image Business person analyzing financial statistics displayed on the tablet screen

Business Person Analyzing Financial Statistics Displayed On The Tablet Screen

4896 × 3344
stock image Business person analyzing financial statistics displayed on the tablet screen

Business Person Analyzing Financial Statistics Displayed On The Tablet Screen

5616 × 3744
stock image Businessman with pen pointing to graph, financial data, research, development, market report. Strategic planning, analyzing, and calculating financial accounts with a a calculator and laptop in the office.

Businessman With Pen Pointing To Graph, Financial Data, Research, Development, Market Report. Strategic Planning, Analyzing, And Calculating Financial Accounts With A A Calculator And Laptop In The Office.

6000 × 3376
stock image close up.businessman makes a financial report. rear view

Close Up.businessman Makes A Financial Report. Rear View

5472 × 3648
stock image Head of accounting is recording the company's financial growth statistics using graphs as a reference for reviewing and analyzing the results, Taking notes and analyzing data graphs in office.

Head Of Accounting Is Recording The Company's Financial Growth Statistics Using Graphs As A Reference For Reviewing And Analyzing The Results, Taking Notes And Analyzing Data Graphs In Office.

6240 × 3504
stock image Businessmen use graphs to summarize results and calculate income-expenses to find financial balance points and use them to improve and advance business, finance and economic concepts.

Businessmen Use Graphs To Summarize Results And Calculate Income-expenses To Find Financial Balance Points And Use Them To Improve And Advance Business, Finance And Economic Concepts.

5472 × 3202