photo free
Home Images Vectors Videos

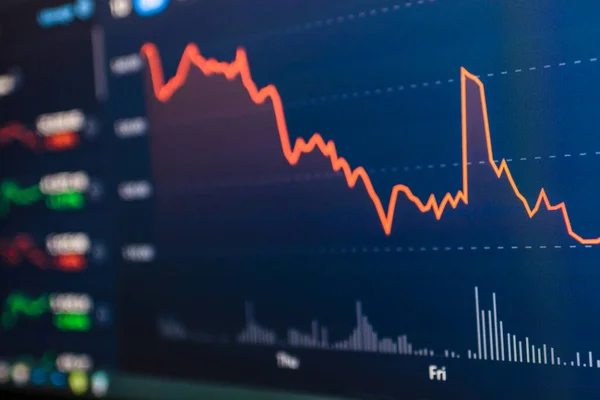
Stock image Close up of declining finance diagram with world exchange rate in virtual screen background

Stock image Close up of declining finance diagram with world exchange rate in virtual screen background
Published: Sep.22, 2021 08:31:39
Author: realinemedia
Views: 1
Downloads: 0
File type: image / jpg
File size: 17.31 MB
Orginal size: 6000 x 4000 px
Available sizes:
S
(500 x 333)
M
(1000 x 667)
L
(2000 x 1333)
XL
(6000 x 4000)
EL0
(6000 x 4000)
Level: gold
Download Image
Image topics:

Similar stock images

stock image Candle stick graph chart with indicator showing bullish point or

Candle Stick Graph Chart With Indicator Showing Bullish Point Or

6016 × 4016
stock image Stock market down chart on the screen. Selective focus.

Stock Market Down Chart On The Screen. Selective Focus.

6016 × 4016
stock image Candle display of the price chart. The beginning of a bearish trend. The intersection of two moving averages followed by a fall in the price.

Candle Display Of The Price Chart. The Beginning Of A Bearish Trend. The Intersection Of Two Moving Averages Followed By A Fall In The Price.

6000 × 4000
stock image Stock market exchange loss trading graph analysis investment ind

Stock Market Exchange Loss Trading Graph Analysis Investment Ind

6016 × 4016
stock image Stock market exchange loss trading graph analysis investment ind

Stock Market Exchange Loss Trading Graph Analysis Investment Ind

6016 × 4016
stock image Stock market exchange graph price with investment of business fi

Stock Market Exchange Graph Price With Investment Of Business Fi

6016 × 4016
stock image Volume analysis for professional technical analysis on the monitor of a computer. Fundamental and technical analysis concept.

Volume Analysis For Professional Technical Analysis On The Monitor Of A Computer. Fundamental And Technical Analysis Concept.

8858 × 4724
stock image Stock market graph on led screen. Finance and investment concept. Selective focus. Charts of financial instruments with various type of indicators including volume analysis for professional technical

Stock Market Graph On Led Screen. Finance And Investment Concept. Selective Focus. Charts Of Financial Instruments With Various Type Of Indicators Including Volume Analysis For Professional Technical

5472 × 3648