photo free
Home Images Vectors Videos

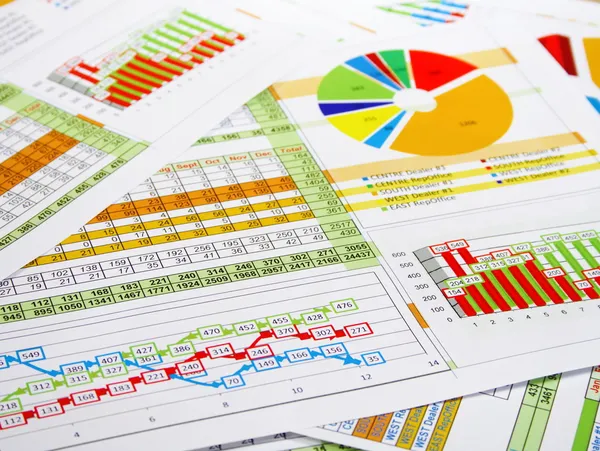
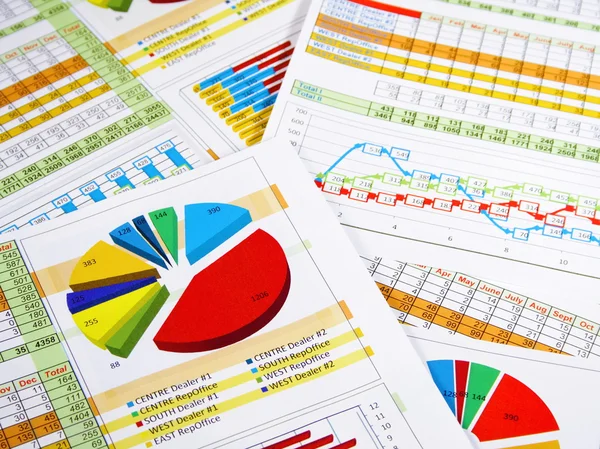
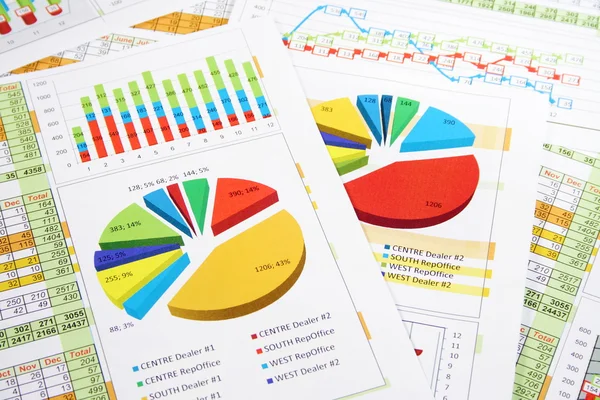
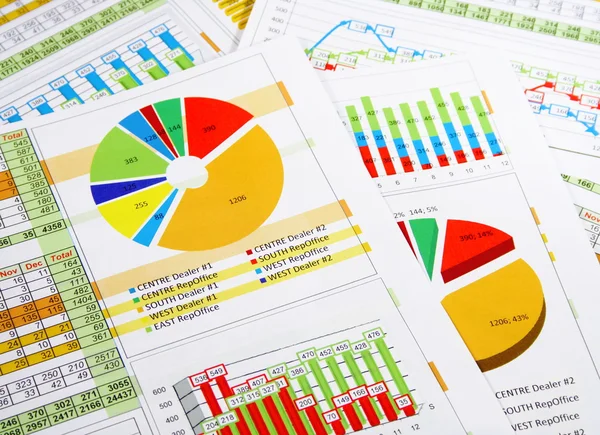
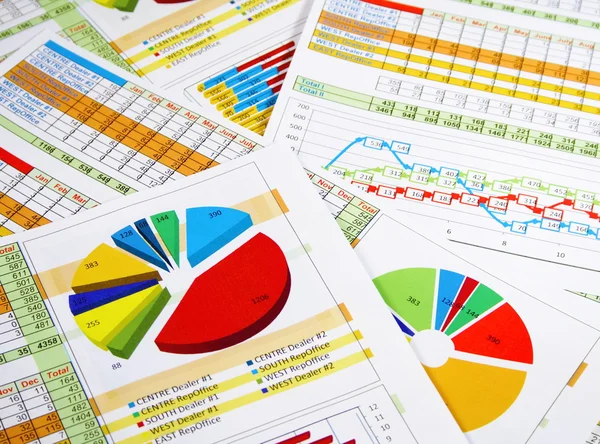
Stock image Colorful Sales Report in Digits, Graphs and Charts
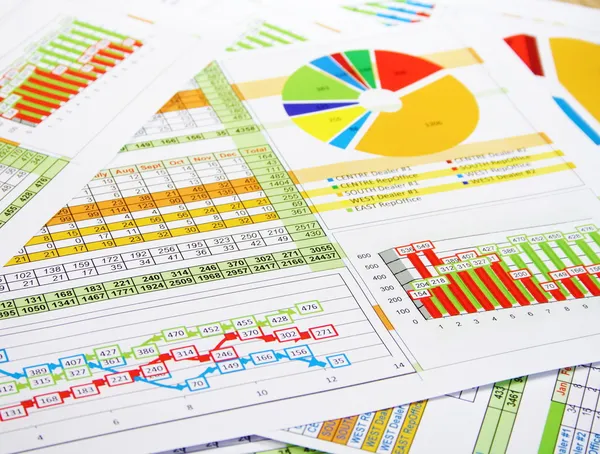
Stock image Colorful Sales Report in Digits, Graphs and Charts
Published: Mar.06, 2012 16:33:59
Author: nataliia
Views: 1500
Downloads: 232
File type: image / jpg
File size: 5.21 MB
Orginal size: 3044 x 2304 px
Available sizes:
S
(500 x 378)
M
(1000 x 757)
L
(2000 x 1514)
XL
(3044 x 2304)
EL0
(3044 x 2304)
Level: bronze
Download Image
Image topics:

Similar stock images

stock image Report in Charts and Diagrams

Report In Charts And Diagrams

3060 × 2304
stock image Annual Report in Charts and Diagrams

Annual Report In Charts And Diagrams

3078 × 2304
stock image Sales Report in Digits, Graphs and Charts

Sales Report In Digits, Graphs And Charts

3456 × 2304
stock image Annual Report in Graphs and Charts

Annual Report In Graphs And Charts

3174 × 2304
stock image Annual Report in Graphs and Diagrams

Annual Report In Graphs And Diagrams

3108 × 2304
stock image Graphical chart

Graphical Chart

3053 × 4260
stock image Flat top view of businessman working and calculating finance, reads and writes reports. Business financial accounting concept.

Flat Top View Of Businessman Working And Calculating Finance, Reads And Writes Reports. Business Financial Accounting Concept.

8256 × 5504
stock image Printed Business Reports in Colors

Printed Business Reports In Colors

5184 × 3744