photo free
Home Images Vectors Videos

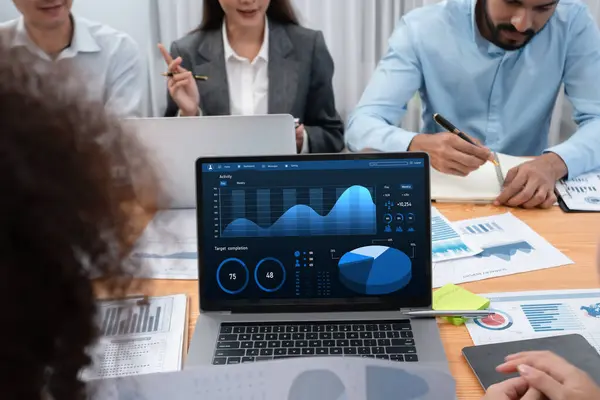
Stock image Diverse group of business analyst team analyzing financial data report. Finance data analysis chart and graph dashboard show on TV screen in meeting room for strategic marketing planning. Habiliment

Stock image Diverse group of business analyst team analyzing financial data report. Finance data analysis chart and graph dashboard show on TV screen in meeting room for strategic marketing planning. Habiliment
Published: Apr.24, 2024 15:20:15
Author: BiancoBlue
Views: 1
Downloads: 0
File type: image / jpg
File size: 12.94 MB
Orginal size: 7952 x 5304 px
Available sizes:
S
(500 x 334)
M
(1000 x 667)
L
(2000 x 1334)
XL
(7952 x 5304)
EL0
(7952 x 5304)
Level: gold
Download Image
Image topics:

Similar stock images

stock image Diverse group of business analyst team analyzing financial data report. Finance data analysis chart and graph dashboard show on TV screen in meeting room for strategic marketing planning. Habiliment

Diverse Group Of Business Analyst Team Analyzing Financial Data Report. Finance Data Analysis Chart And Graph Dashboard Show On TV Screen In Meeting Room For Strategic Marketing Planning. Habiliment

7952 × 5304
stock image Multiracial analyst team use BI Fintech software to analyze financial data on meeting table. Financial dashboard data display on laptop screen with analyzed chart for marketing indication. Concord

Multiracial Analyst Team Use BI Fintech Software To Analyze Financial Data On Meeting Table. Financial Dashboard Data Display On Laptop Screen With Analyzed Chart For Marketing Indication. Concord

5168 × 3448
stock image UX UI design process for modish mobile application and website . Creative prototype of wireframe for professional app developer .

UX UI Design Process For Modish Mobile Application And Website . Creative Prototype Of Wireframe For Professional App Developer .

7952 × 5304
stock image Analyst team use BI dashboard data to analyze financial report on meeting table. Group of diverse business people utilize data analysis by FIntech for business marketing decision. Concord

Analyst Team Use BI Dashboard Data To Analyze Financial Report On Meeting Table. Group Of Diverse Business People Utilize Data Analysis By FIntech For Business Marketing Decision. Concord

6804 × 4209
stock image Diverse group of business analyst team analyzing financial data report. Finance data analysis chart and graph dashboard show on TV screen in meeting room for strategic marketing planning. Habiliment

Diverse Group Of Business Analyst Team Analyzing Financial Data Report. Finance Data Analysis Chart And Graph Dashboard Show On TV Screen In Meeting Room For Strategic Marketing Planning. Habiliment

5168 × 3448
stock image Businessman and businesswomen working in office.

Businessman And Businesswomen Working In Office.

5168 × 3448
stock image Multiracial analyst team use BI Fintech software to analyze financial data on meeting table. Financial dashboard data display on laptop screen with analyzed chart for marketing indication. Concord

Multiracial Analyst Team Use BI Fintech Software To Analyze Financial Data On Meeting Table. Financial Dashboard Data Display On Laptop Screen With Analyzed Chart For Marketing Indication. Concord

5168 × 3448
stock image Panorama shot analyst team utilizing BI Fintech to analyze financial report with laptop. Businesspeople analyzing BI power dashboard displayed on laptop screen for business insight. Scrutinize

Panorama Shot Analyst Team Utilizing BI Fintech To Analyze Financial Report With Laptop. Businesspeople Analyzing BI Power Dashboard Displayed On Laptop Screen For Business Insight. Scrutinize

8149 × 3770