Home
Images
Vectors
Videos
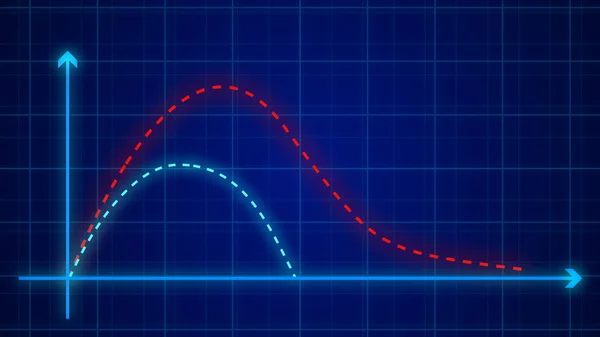
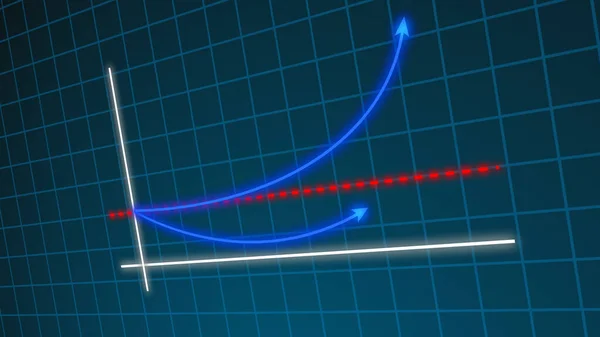
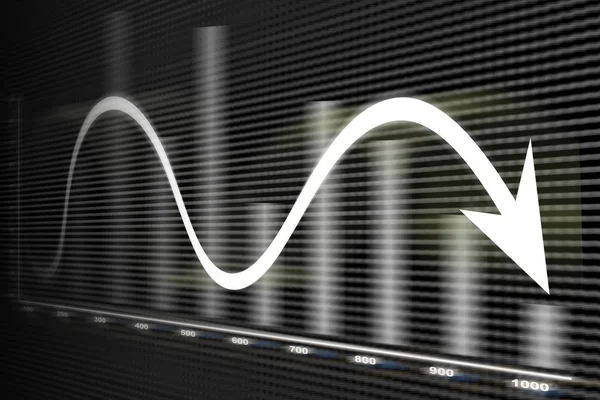
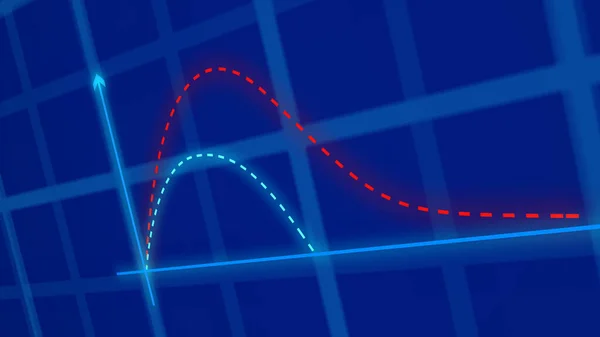
Stock image Dotted graph with another graph explaining growth expected and real growth analysis. 3d Infographics. 3d Chart with camera movement or angle.
Published:
May.18, 2023 10:30:37
Author:
PhoenixStock
Views:
0
Downloads:
0
File type:
image
/
jpg
File size:
3.37 MB
Orginal size:
7680
x
4320
px
Available sizes:
S
(500 x 281)
M
(1000 x 563)
L
(2000 x 1125)
XL
(7680 x 4320)
EL0
(7680 x 4320)
Level:
beginner
Download Image
Image topics:
Background
Money
Business
Financial
Market
Rate
Trading
Success
Growth
Abstract
Technology
Graphics
Concept
Price
Display
Digital
Global
Monitor
Information
Presentation
Bank
Banking
Currency
Exchange
Investment
Finance
Stock
Economy
Arrows
Report
Investors
Index
Analysis
Graph
Management
Chart
Sell
Economic
Trade
Statistics
Profit
Diagram
Forex
Datum
Stockholder
Stock Market
Stock Exchange
4k
Growth Concept
Forex Trading
Similar stock images
Dotted Graph With Another Graph Explaining Growth Expected And Real Growth Analysis. 3d Infographics. 3d Chart With Camera Movement Or Angle.
7680 × 4320
Creative Stock Exchange Graph, Return On Investment Graph Animation In High Resolution. Graph Animation.
7680 × 4320
Dotted Graph With Another Graph Explaining Growth Expected And Real Growth Analysis. 3d Infographics. 3d Chart With Camera Movement Or Angle.
7680 × 4320
Surreal Illustration. Beautiful Creative Background.
2776 × 2772
Financial And Business Graphs
5616 × 3744
Financial And Business Graphs
5616 × 3744
Financial And Business Graphs
3744 × 3744
Finance Spreadsheet Chart Data
5100 × 3300