Home
Images
Vectors
Videos
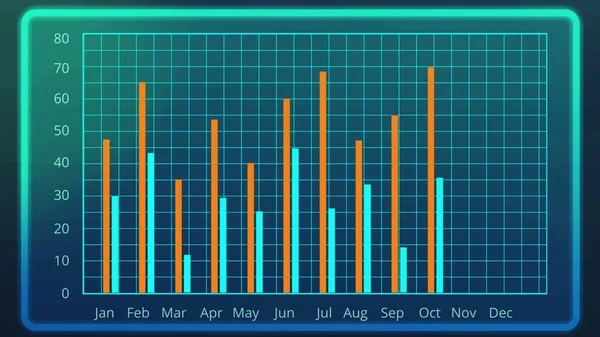
Stock image Electronic bar chart showing monthly results compared to previous year data
Published:
Dec.19, 2017 16:00:54
Author:
motortion
Views:
45
Downloads:
4
File type:
image
/
jpg
File size:
0.69 MB
Orginal size:
3840
x
2160
px
Available sizes:
S
(500 x 281)
M
(1000 x 563)
L
(2000 x 1125)
XL
(3840 x 2160)
EL0
(3840 x 2160)
Level:
gold
Download Image
Image topics:
Bar
Computer
Money
Design
Business
Financial
Market
Growth
Line
Graphics
Year
Price
Data
Development
Information
Presentation
Finance
Output
Economy
Strategy
Production
Foreign
Forecast
Imagery
Company
Plan
Report
Index
Analysis
Graph
Results
Chart
Month
Curves
Economic
Statement
International
Review
Outlook
Trade
Statistics
Summary
Annual
Graphical
Demographic
Analytical
Gdp
Similar stock images
Computer-generated Shot Of Bar Graph, Presentation Of Analytical Survey Results
3840 × 2160
Constantly Changing Flickering Stock Graph, Creative Infographics Animation. Data Visualization. Forex Trade Graph.
7680 × 4320
Constantly Changing Flickering Stock Graph, Creative Infographics Animation. Data Visualization. Forex Trade Graph.
7680 × 4320
Constantly Changing Flickering Stock Graph, Creative Infographics Animation. Data Visualization. Forex Trade Graph.
7680 × 4320
Stock Chart With Red Fall Indicator
3333 × 2046
Image Of Data Processing Over Shapes On Black Background. Global Technology, Computing And Digital Interface Concept Digitally Generated Image.
4096 × 2160
Computer Screen 89 Percent Data Completed
5184 × 3456
Finance Data Business Concept
3840 × 2160