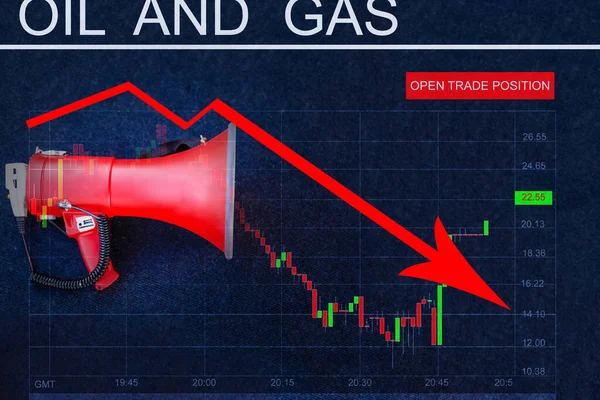
Stock image Falling brent oil prices in the stock market. Financial crisis concept
Published: Apr.21, 2020 10:07:39
Author: ZahPhoto
Views: 0
Downloads: 0
File type: image / jpg
File size: 4.55 MB
Orginal size: 5272 x 3954 px
Available sizes:
Level: beginner
Similar stock images


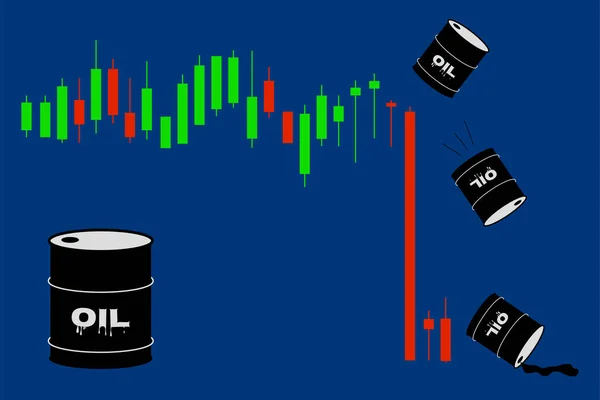
Falling Oil Price Chart Against The Background Of Gray Barrels. Financial Market Concept
6000 × 4000

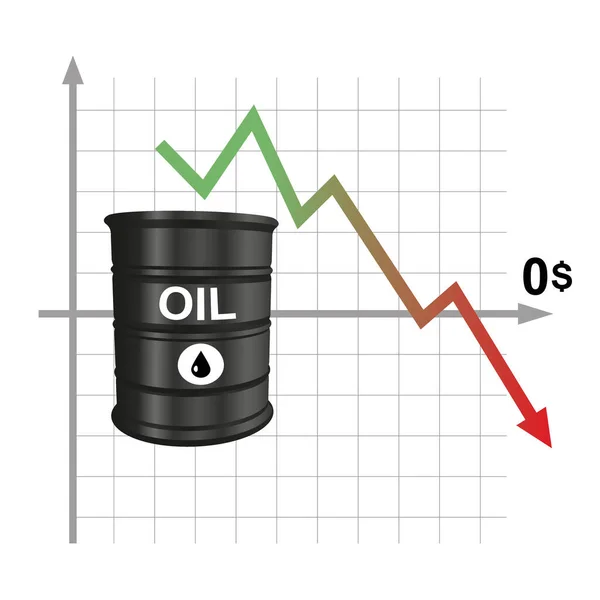
Falling Oil Price Red Chart On Background Of Gray Barrels Dollar Bill. Financial Market Concept
6000 × 4000
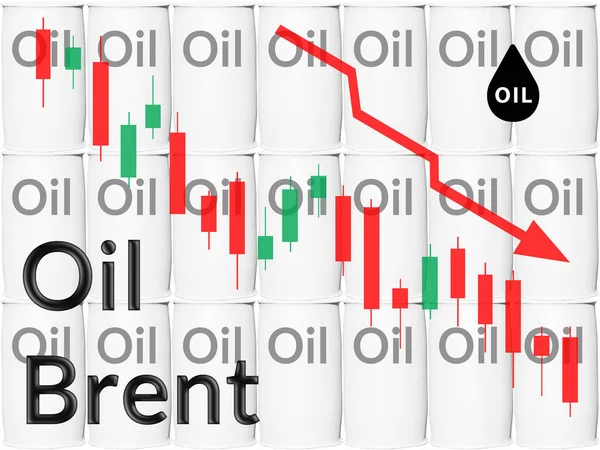
Falling Oil Price Red Chart And Text On Background Of Gray Barrels Dollar Bill. Financial Market Concept
6000 × 4000