photo free
Home Images Vectors Videos

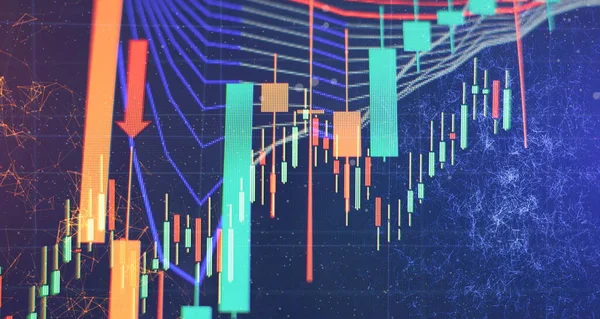
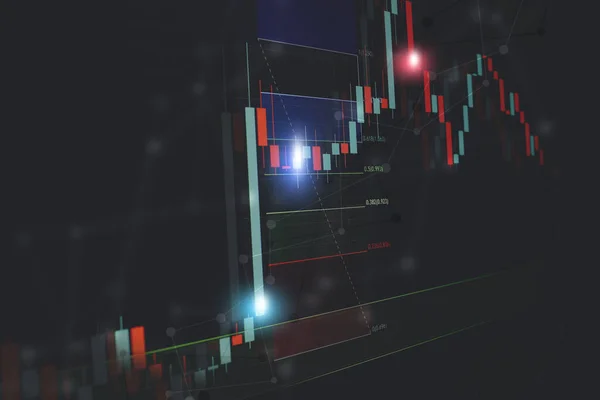
Stock image finance candles chart market. stock and finance trading graph background

Stock image finance candles chart market. stock and finance trading graph background
Published: Jun.29, 2022 08:24:33
Author: alexaldo
Views: 1
Downloads: 0
File type: image / jpg
File size: 4.28 MB
Orginal size: 5472 x 2391 px
Available sizes:
S
(500 x 218)
M
(1000 x 437)
L
(2000 x 874)
XL
(5472 x 2391)
EL0
(5472 x 2391)
Level: bronze
Download Image
Image topics:

Similar stock images

stock vector Global financial in graphic futuristic concept suitable for global financial investment or Economic trends business idea and all art work design, vector illustration.

Global Financial In Graphic Futuristic Concept Suitable For Global Financial Investment Or Economic Trends Business Idea And All Art Work Design, Vector Illustration.

10000 × 6250
stock image Stock index on the computer monitor . Financial data on a monitor which including of Market Analyze. Bar graphs, Diagrams, financial figures.

Stock Index On The Computer Monitor . Financial Data On A Monitor Which Including Of Market Analyze. Bar Graphs, Diagrams, Financial Figures.

8858 × 4724
stock image finance candles chart market. digital finance trading graph background

Finance Candles Chart Market. Digital Finance Trading Graph Background

5472 × 3648
stock image Economic graph with diagrams on the stock market, for business and financial concepts and reports.Abstract blue background.

Economic Graph With Diagrams On The Stock Market, For Business And Financial Concepts And Reports.Abstract Blue Background.

5315 × 3543
stock image Dashboard graph of forex statistics, business and financial analytics, profit and cost rate, monitor screen in perspective

Dashboard Graph Of Forex Statistics, Business And Financial Analytics, Profit And Cost Rate, Monitor Screen In Perspective

9190 × 5169
stock image finance stock currency fibonacci correction trading banner

Finance Stock Currency Fibonacci Correction Trading Banner

5000 × 2200
stock image stock indexes in virtual space. Economic growth, recession. Electronic virtual platform showing trends and stock market fluctuations

Stock Indexes In Virtual Space. Economic Growth, Recession. Electronic Virtual Platform Showing Trends And Stock Market Fluctuations

5315 × 3543
stock vector Business graph with tending. Stock market data display concept. Stock Market Prices. Candle stick stock market tracking graph. Economical stock market graph.

Business Graph With Tending. Stock Market Data Display Concept. Stock Market Prices. Candle Stick Stock Market Tracking Graph. Economical Stock Market Graph.

8000 × 4999