Home
Images
Vectors
Videos
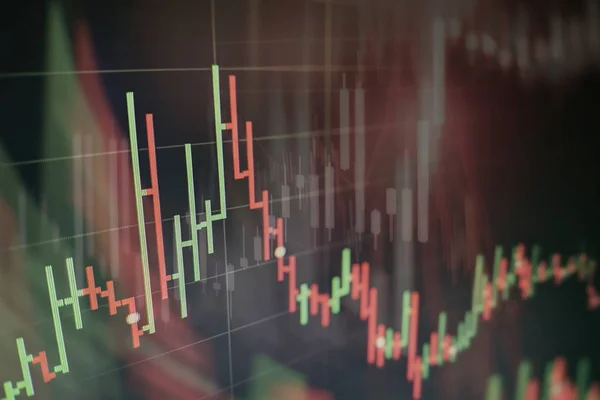
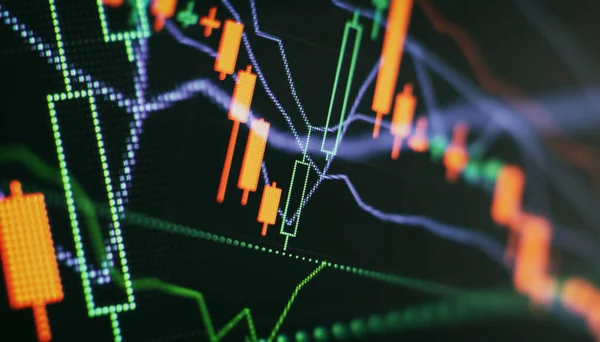
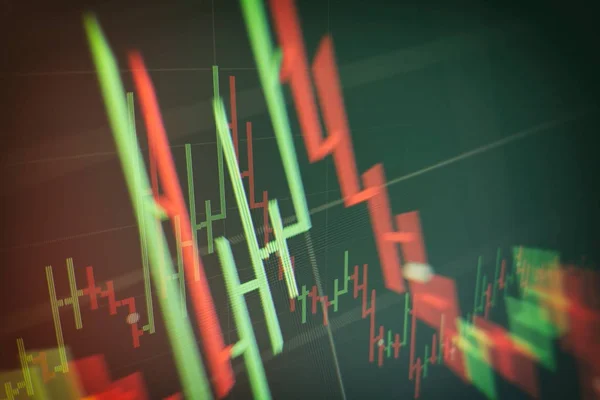
Stock image Financial chart with up trend line graph. Wealth management with risk
Published:
Apr.28, 2024 05:48:34
Author:
Maximusdn
Views:
0
Downloads:
0
File type:
image
/
jpg
File size:
4.81 MB
Orginal size:
8268
x
3189
px
Available sizes:
S
(500 x 193)
M
(1000 x 386)
L
(2000 x 771)
XL
(8268 x 3189)
EL0
(8268 x 3189)
Level:
bronze
Download Image
Image topics:
Money
High
Buy
Financial
Market
Rate
Growth
Corporate
Estate
Real
Global
Equity
Bank
Exchange
Investment
Finance
Invest
Stock
Wheel
Security
Gain
System
Instruments
Free
Purchase
Yield
Value
Investing
Fixed
Debt
Commodity
Trade
Government
Pension
Portfolio
Bond
Revenue
Profit
Coupon
Fund
Investor
Mutual
Shares
Dividend
Municipal
Diversify
Trusts
Etf
Capm
Securitization
Similar stock images
Candle Stick Graph Chart Of Stock Market Investment Trading, Stock Exchange Concept Design And Background.
5315 × 3543
Stock Market Business Graph Chart On Digital Screen.Forex Market, Gold Market And Crude Oil Market .
8268 × 4724
Financial Chart With Line Graph In Stock Market
9803 × 4488
Candle Stick Graph Chart Of Stock Market Investment Trading, Stock Exchange Concept Design And Background.
5315 × 3543
Candle Stick Graph Chart Of Stock Market Investment Trading, Stock Exchange Concept Design And Background.
5315 × 3543
Candle Stick Graph Chart Of Stock Market Investment Trading, Stock Exchange Concept Design And Background.
5315 × 3543
Green Candlesticks Going Up Indicating Crypto Rising In Value. Graphical Representation Of Volumes And Time Intervals Of Digital Cryptocurrency Past Price
9803 × 4488
Business Financial Or Stock Market Background. Business Graph On Stock Market Financial Exchange
8268 × 4724