photo free
Home Images Vectors Videos

Stock image Financial data on a monitor,candle stick graph of stock market ,
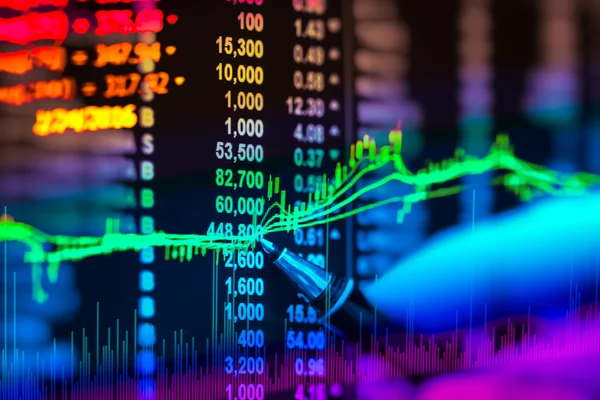
Stock image Financial data on a monitor,candle stick graph of stock market ,
Published: May.31, 2016 13:52:37
Author: phongphan
Views: 22
Downloads: 10
File type: image / jpg
File size: 4.53 MB
Orginal size: 5184 x 3456 px
Available sizes:
S
(500 x 333)
M
(1000 x 667)
L
(2000 x 1333)
XL
(5184 x 3456)
EL0
(5184 x 3456)
Level: bronze
Download Image
Image topics:

Similar stock images

stock image Financial data on a monitor,selective focus on LED monitor, stock market data on LED display concept

Financial Data On A Monitor,selective Focus On LED Monitor, Stock Market Data On LED Display Concept

5184 × 3456
stock image Data analyzing in exchange cryptocurrency market: the candles charts , bars and other trade analysis indicators on display. Analytics price change cryptocurrency BTC to USD - Bitcoin / US Dollar.

Data Analyzing In Exchange Cryptocurrency Market: The Candles Charts , Bars And Other Trade Analysis Indicators On Display. Analytics Price Change Cryptocurrency BTC To USD - Bitcoin / US Dollar.

6000 × 4000
stock image Stock market graph chart - stock exchange trading analysis investment financial display stock crisis crash down and grow up trand profits financial or forex graph stock market digital graph business

Stock Market Graph Chart - Stock Exchange Trading Analysis Investment Financial Display Stock Crisis Crash Down And Grow Up Trand Profits Financial Or Forex Graph Stock Market Digital Graph Business

6016 × 4016
stock image 3D rendering of stock indexes in virtual space. Economic growth, recession. Electronic virtual platform showing trends and stock market fluctuations

3D Rendering Of Stock Indexes In Virtual Space. Economic Growth, Recession. Electronic Virtual Platform Showing Trends And Stock Market Fluctuations

3840 × 2160
stock image Financial data on a monitor,Stock market data on LED display con

Financial Data On A Monitor,Stock Market Data On LED Display Con

5184 × 3456
stock image Data analyzing in exchange cryptocurrency market: the candles charts , bars and other trade analysis indicators on display. Analytics price change cryptocurrency BTC to USD - Bitcoin / US Dollar.

Data Analyzing In Exchange Cryptocurrency Market: The Candles Charts , Bars And Other Trade Analysis Indicators On Display. Analytics Price Change Cryptocurrency BTC To USD - Bitcoin / US Dollar.

6000 × 4000
stock image Stock market crash statistics hologram on screen. Business and financial crisis concept. 3D Rendering

Stock Market Crash Statistics Hologram On Screen. Business And Financial Crisis Concept. 3D Rendering

4500 × 3000
stock image Index graph of stock market financial indicator analysis on LED.

Index Graph Of Stock Market Financial Indicator Analysis On LED.

5184 × 3456