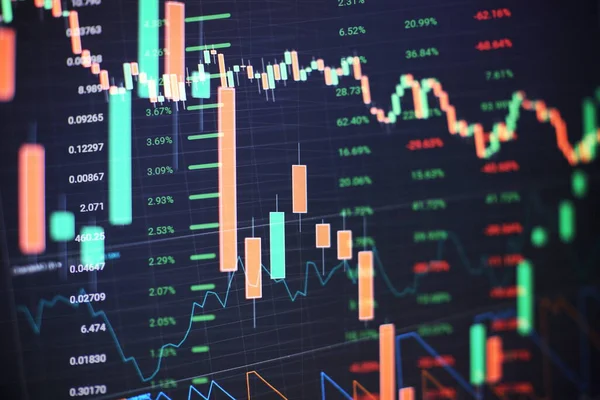
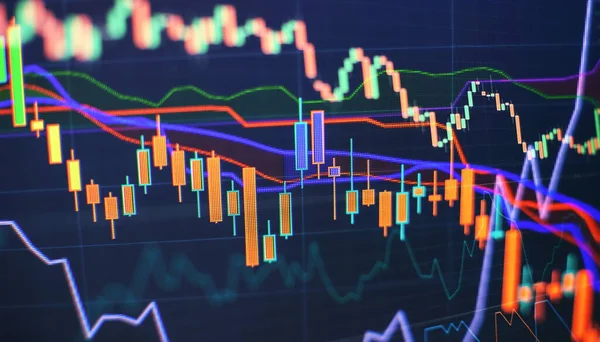
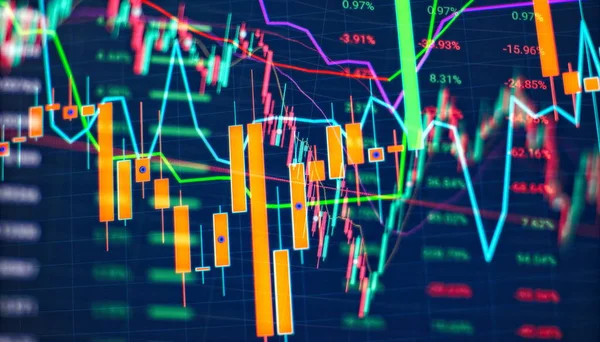
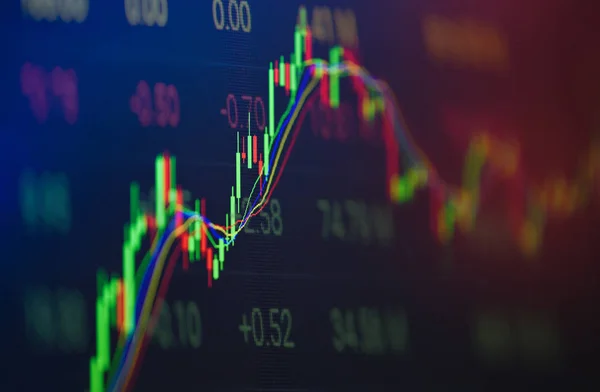
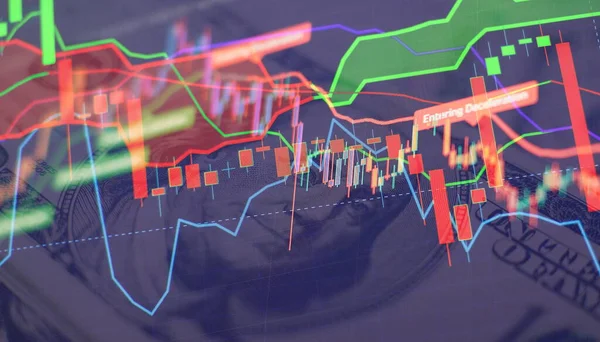
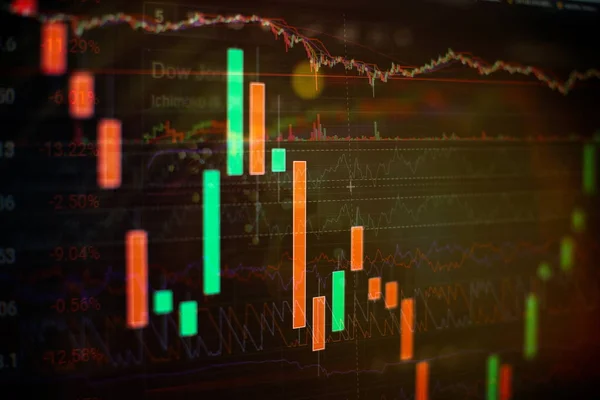
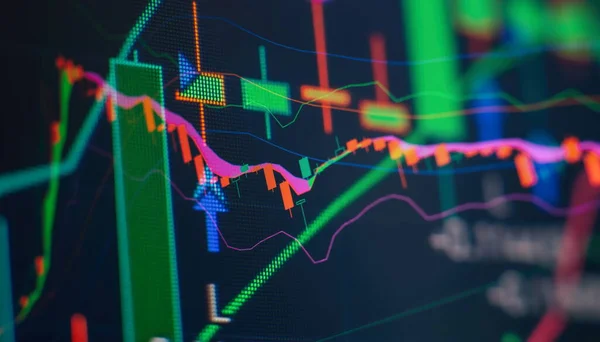
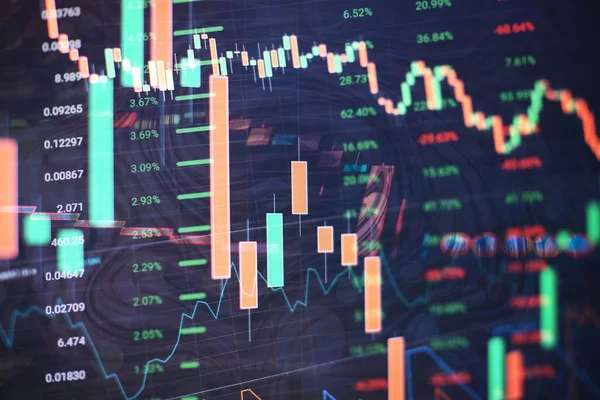
Stock image forex trading graph and candlestick chart suitable for financial investment concept. Economy trends background for business idea and all art work design. Abstract finance background.
Published: May.04, 2022 07:35:04
Author: Maximusdn
Views: 3
Downloads: 2
File type: image / jpg
File size: 7.26 MB
Orginal size: 5315 x 3543 px
Available sizes:
Level: bronze