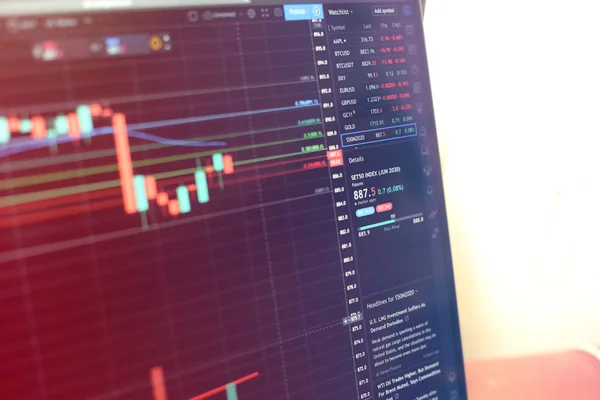
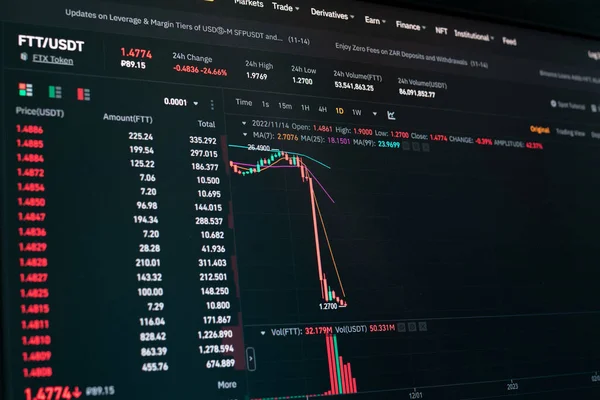
Stock image Global fall of cryptocurrency graph - FTT token fell down on the chart crypto exchanges on app screen. FTX exchange bankruptcy and the collapse depreciation of token
Published: Nov.21, 2022 13:43:10
Author: sfinks
Views: 2
Downloads: 2
File type: image / jpg
File size: 7.78 MB
Orginal size: 5168 x 3448 px
Available sizes:
Level: bronze