photo free
Home Images Vectors Videos

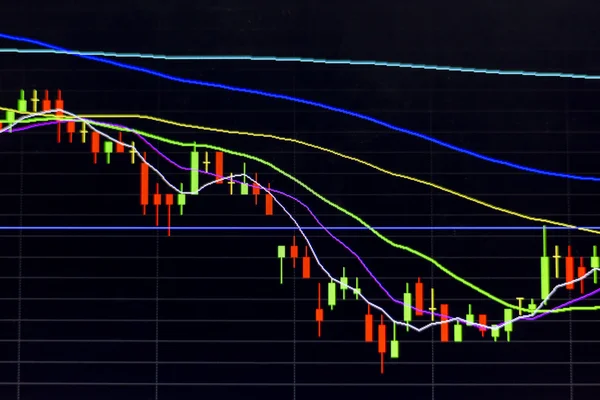
Stock image Graph

Stock image Graph
Published: Feb.10, 2014 07:26:47
Author: studio306stock
Views: 98
Downloads: 5
File type: image / jpg
File size: 5.52 MB
Orginal size: 5143 x 3225 px
Available sizes:
S
(500 x 314)
M
(1000 x 627)
L
(2000 x 1254)
XL
(5143 x 3225)
EL0
(5143 x 3225)
Level: bronze
Download Image
Image topics:

Similar stock images

stock image candle stick stock chart

Candle Stick Stock Chart

5760 × 3840
stock image Candle stick graph chart with indicator showing bullish point or bearish point, up trend or down trend of price of stock market or stock exchange trading, investment and financial concept.

Candle Stick Graph Chart With Indicator Showing Bullish Point Or Bearish Point, Up Trend Or Down Trend Of Price Of Stock Market Or Stock Exchange Trading, Investment And Financial Concept.

6000 × 4000
stock image Candle stick graph chart with indicator showing bullish point or

Candle Stick Graph Chart With Indicator Showing Bullish Point Or

6000 × 4000
stock image Detail of Electronic Grid Monitor Screen

Detail Of Electronic Grid Monitor Screen

3777 × 2553
stock image Candle stick graph chart with indicator showing bullish point or bearish point, up trend or down trend of price of stock market or stock exchange trading, investment and financial concept. thin focus.

Candle Stick Graph Chart With Indicator Showing Bullish Point Or Bearish Point, Up Trend Or Down Trend Of Price Of Stock Market Or Stock Exchange Trading, Investment And Financial Concept. Thin Focus.

6000 × 4000