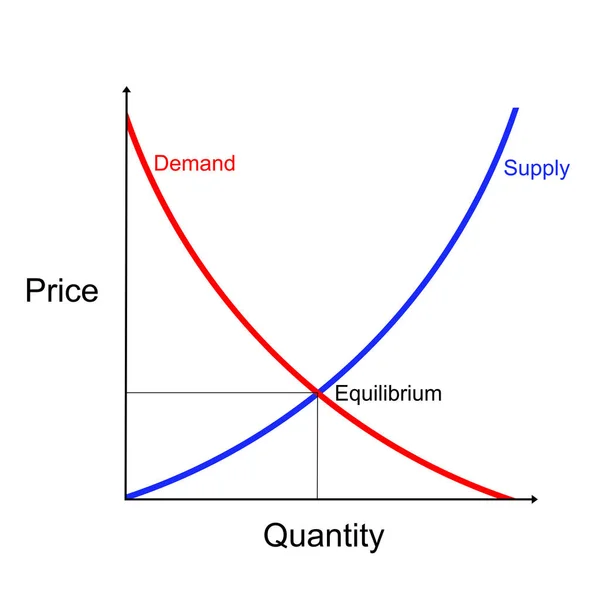
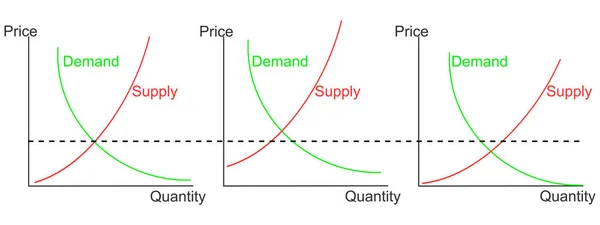
Stock image Graph of a function

Published: Jan.15, 2016 10:57:09
Author: benjaminec
Views: 48
Downloads: 2
File type: image / jpg
File size: 2.55 MB
Orginal size: 3220 x 2390 px
Available sizes:
Level: bronze