photo free
Home Images Vectors Videos

Stock image Graph Report Shows Investment Forecast And Business
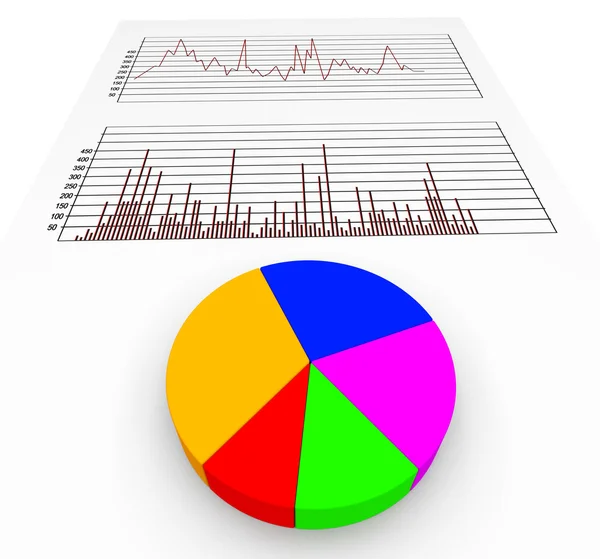
Stock image Graph Report Shows Investment Forecast And Business
Published: May.28, 2015 08:56:52
Author: stuartmiles
Views: 25
Downloads: 0
File type: image / jpg
File size: 1.75 MB
Orginal size: 3216 x 3000 px
Available sizes:
S
(500 x 466)
M
(1000 x 933)
L
(2000 x 1866)
XL
(3216 x 3000)
EL0
(3216 x 3000)
Level: silver
Download Image
Image topics:

Similar stock images

stock image Graph Report Means Biz Trade And Diagram

Graph Report Means Biz Trade And Diagram

3000 × 3000
stock image Graph Report Represents Data Corporate And Forecast

Graph Report Represents Data Corporate And Forecast

3720 × 3000
stock image Business chart

Business Chart

6200 × 4430
stock image Pie Chart Shows Statistical Graphs And Graphics

Pie Chart Shows Statistical Graphs And Graphics

4000 × 3000
stock image 3D business chart illustration, white background

3D Business Chart Illustration, White Background

4000 × 4000
stock image Business

Business

2400 × 1800
stock image 3D business chart illustration, white background

3D Business Chart Illustration, White Background

4608 × 3072
stock image Business analyzing

Business Analyzing

5000 × 3750