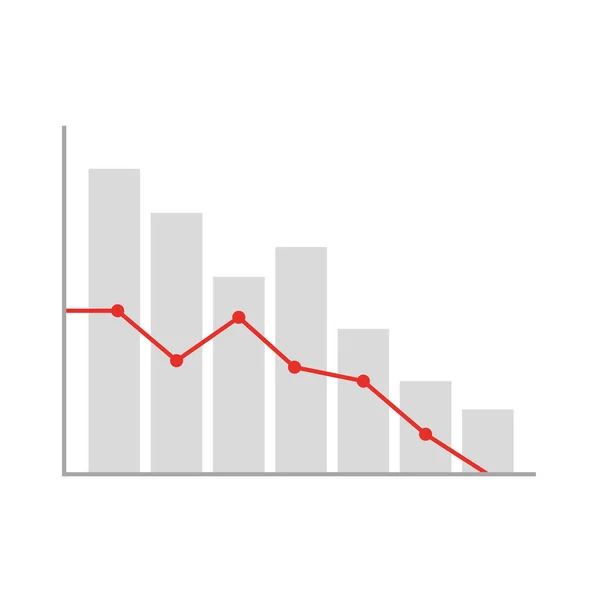
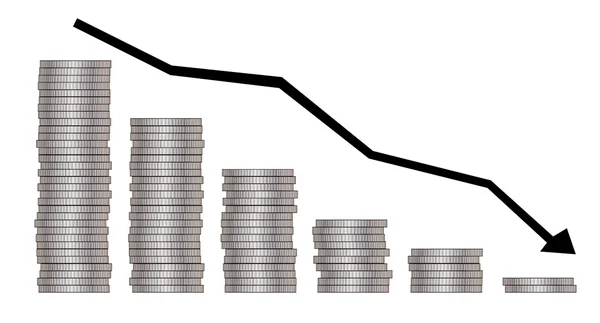
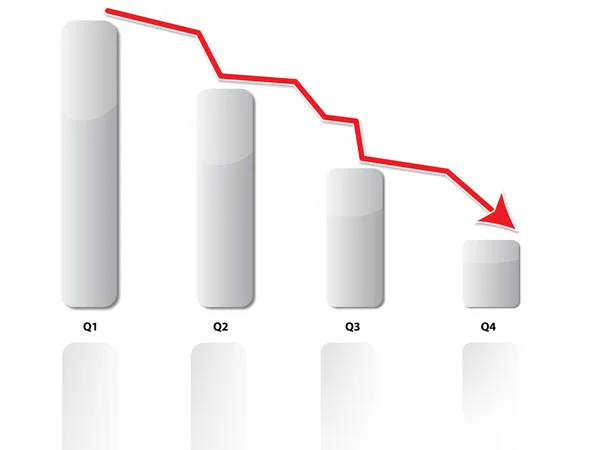
Stock image Graph showing decline of profit over an year
Published: Apr.21, 2015 08:53:25
Author: Lucian3D
Views: 132
Downloads: 4
File type: image / jpg
File size: 1.23 MB
Orginal size: 4000 x 3000 px
Available sizes:
Level: bronze