Home
Images
Vectors
Videos
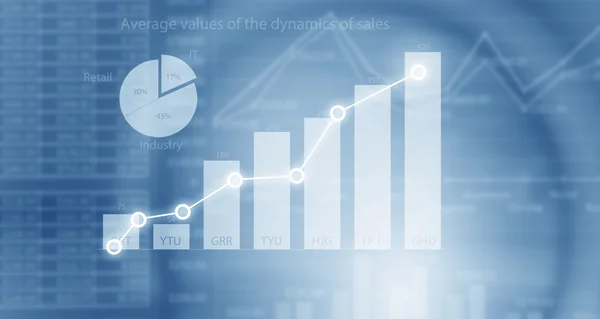
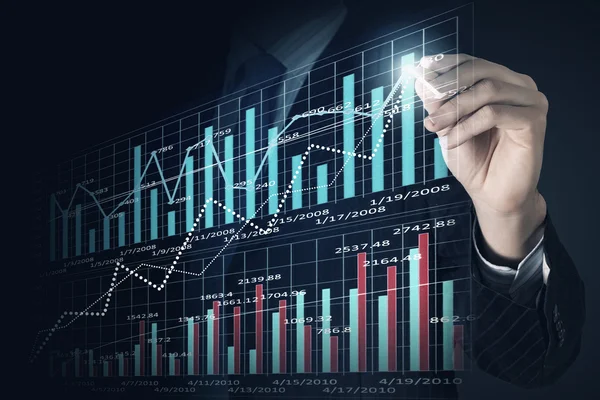
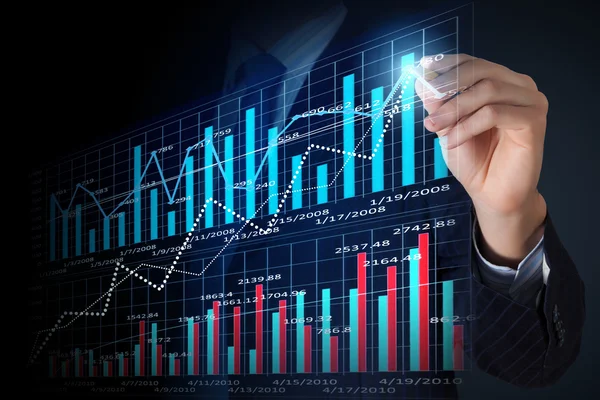
Stock image Illustrate Ascending Descending Trend Performance Bar Graph Unstable Annual Profit. Showing Upward Downward Growth Uncertain Movement High Risk Financial Stock Chart Status Report
Published:
Jun.12, 2020 11:00:11
Author:
artursz
Views:
17
Downloads:
4
File type:
image
/
jpg
File size:
4.29 MB
Orginal size:
5616
x
3744
px
Available sizes:
S
(500 x 333)
M
(1000 x 667)
L
(2000 x 1333)
XL
(5616 x 3744)
EL0
(5616 x 3744)
Level:
silver
Download Image
Image topics:
Money
Isolated
Business
Financial
Market
Sign
Line
Data
Stress
Performance
Presentation
Investment
Finance
Stock
Crisis
Economy
Negative
Crash
Direction
Report
Volatile
Falling
Loss
Analysis
Graph
Chart
Profit
Diagram
Bankrupt
Increase
Decline
Recession
Risky
Statistic
Unstable
Trend
Imbalance
Uncertainty
Insecurity
Instability
Flowchart
Fluctuation
Inconsistent
Volatility
Unpredictability
Infographic
Fluctuating
Statistical Data
Similar stock images
Man Smartphone Illustrating Ascending Trends Performance Bar Graph Increasing Annual Profits. Showing Upward Growth Escalating Movement Rising Financial Stock Chart Status Report.
6000 × 4005
Man Smartphone Illustrating Ascending Trends Performance Bar Graph Increasing Annual Profits. Showing Upward Growth Escalating Movement Rising Financial Stock Chart Status Report.
5000 × 3327
Illustrate Ascending Descending Trend Performance Bar Graph Unstable Annual Profit. Showing Upward Downward Growth Uncertain Movement High Risk Financial Stock Chart Status Report
6000 × 4005
Sales Dynamics Data
4300 × 2293
Innovative Technologies For Your Business . Mixed Media
4300 × 2867
Man Smartphone Illustrating Ascending Trends Performance Bar Graph Increasing Annual Profits. Showing Upward Growth Escalating Movement Rising Financial Stock Chart Status Report.
6000 × 4005
Businessman With Financial Symbols Coming From Hand
3888 × 2528
Average Sales Report
4300 × 2867