photo free
Home Images Vectors Videos

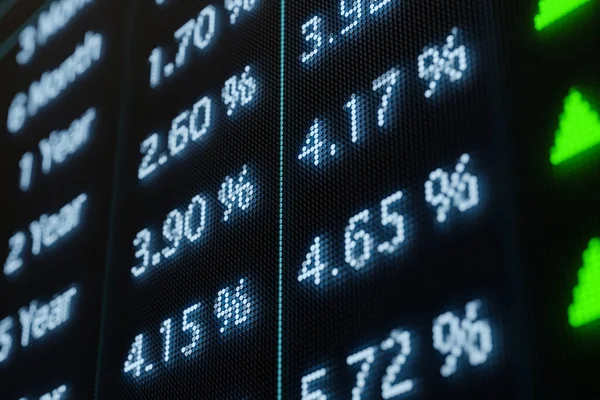
Stock image Index graph of stock market financial indicator analysis on LED.

Stock image Index graph of stock market financial indicator analysis on LED.
Published: Sep.22, 2017 06:35:29
Author: phongphan
Views: 2
Downloads: 0
File type: image / jpg
File size: 7.6 MB
Orginal size: 5184 x 3456 px
Available sizes:
S
(500 x 333)
M
(1000 x 667)
L
(2000 x 1333)
XL
(5184 x 3456)
EL0
(5184 x 3456)
Level: bronze
Download Image
Image topics:

Similar stock images

stock image Index graph of stock market financial indicator analysis on LED.

Index Graph Of Stock Market Financial Indicator Analysis On LED.

5184 × 3456
stock image Screen with rising yields and interest rates. Coupons, rates, yields  and other informations are displayed. Interest rates concept. 3D illustration

Screen With Rising Yields And Interest Rates. Coupons, Rates, Yields And Other Informations Are Displayed. Interest Rates Concept. 3D Illustration

6000 × 4000
stock image technical financial graph on technology abstract background

Technical Financial Graph On Technology Abstract Background

6000 × 4000
stock image Index graph of stock market financial indicator analysis on LED.

Index Graph Of Stock Market Financial Indicator Analysis On LED.

4600 × 3055
stock image Image of data processing over modern building. global business, finances and digital interface concept digitally generated image.

Image Of Data Processing Over Modern Building. Global Business, Finances And Digital Interface Concept Digitally Generated Image.

4096 × 2160
stock image Stock market quotes in city at night

Stock Market Quotes In City At Night

3603 × 1900
stock image Display of Stock market quotes

Display Of Stock Market Quotes

3603 × 1900
stock image Stock exchange or bourse

Stock Exchange Or Bourse

5496 × 3512