Home
Images
Vectors
Videos
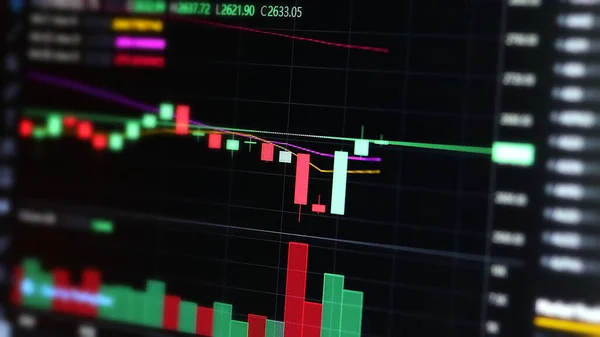
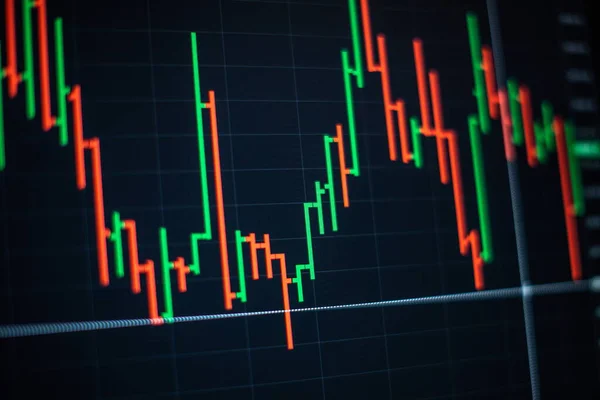
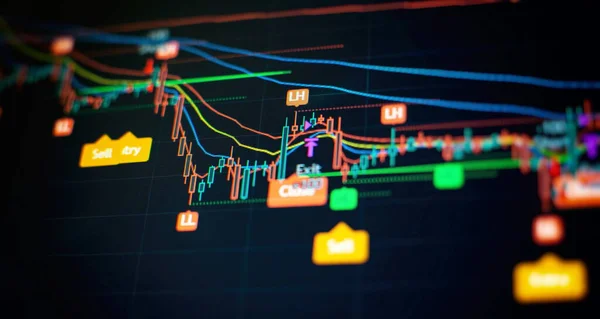
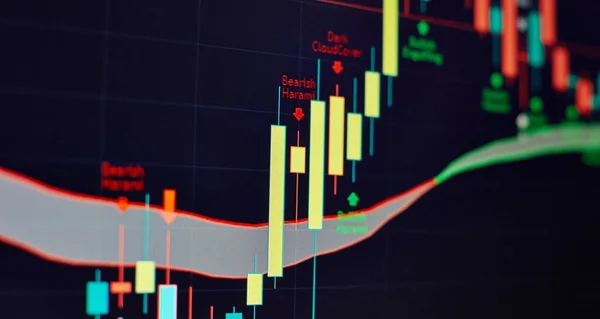
Stock image indicators including volume analysis for professional technical analysis on the monitor of a computer. Fundamental and technical analysis concept.
Published:
Dec.09, 2021 16:07:38
Author:
Maximusdn
Views:
0
Downloads:
0
File type:
image
/
jpg
File size:
7.74 MB
Orginal size:
5315
x
3543
px
Available sizes:
S
(500 x 333)
M
(1000 x 667)
L
(2000 x 1333)
XL
(5315 x 3543)
EL0
(5315 x 3543)
Level:
bronze
Download Image
Image topics:
Computer
Financial
Market
Growth
Board
Line
Flow
Price
Services
Tool
Exchange
Investment
Stock
Future
Security
Volume
Technical
Share
Yield
Bull
Index
Analysis
Graph
Management
Value
Chart
Signal
Economic
Commodity
Trade
Portfolio
Indicator
Linear
Plans
Average
Ticker
Period
Earning
Brokers
Forex
Options
Fundamental
Oscillator
Deviation
Momentum
Warrant
Djia
Sensex
Derivatives
Stochastic
Similar stock images
Stock Exchange, Cryptocurrency Price Chart On A Screen. Candlestick Chart, Btc. Online Currency Exchange Market. Trading, Bidding. Tracking The Cryptocurrency Rate. 4K. Close Up.
3840 × 2160
Working Set For Analyzing Financial Statistics And Analyzing A Market Data.
5315 × 3543
Price Graph And Indicator, Red And Green Candlestick Chart On Blue Theme Screen, Market Volatility, Up And Down Trend. Stock Trading, Crypto Currency Background.
8858 × 4724
Business Success And Growth Concept.Stock Market Business Graph Chart On Digital Screen.Forex Market, Gold Market And Crude Oil Market .
8858 × 4724
Price Graph And Indicator, Red And Green Candlestick Chart On Blue Theme Screen, Market Volatility, Up And Down Trend. Stock Trading, Crypto Currency Background.
8268 × 4724
Financial Statistics, Stock Exchange Prices Summarized In Candle Stick Chart.
8858 × 4724
Bitcoin Cryptocurrency Data Charts
8192 × 5464
Analyze. Bar Graphs, Diagrams, Financial Figures. Forex Chart. - Finance Data Concept. Business Statistics And Analytics Value
8268 × 4488