photo free
Home Images Vectors Videos

Stock image Interest rate moving up. Line chart with rising interest rate. Business, investment, yield and mortages rates.
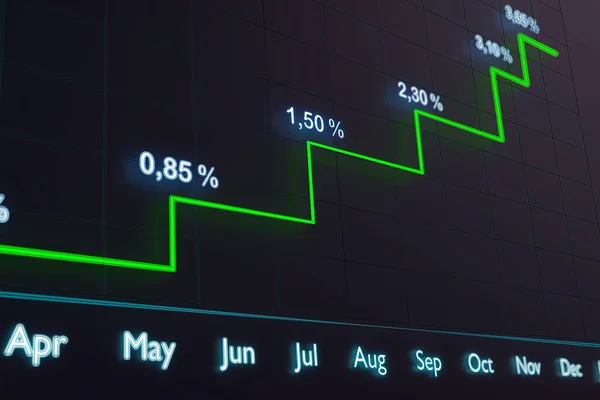
Stock image Interest rate moving up. Line chart with rising interest rate. Business, investment, yield and mortages rates.
Published: May.04, 2023 14:21:13
Author: Westlight
Views: 2
Downloads: 1
File type: image / jpg
File size: 6.1 MB
Orginal size: 6000 x 4000 px
Available sizes:
S
(500 x 333)
M
(1000 x 667)
L
(2000 x 1333)
XL
(6000 x 4000)
EL0
(6000 x 4000)
Level: beginner
Download Image
Image topics:

Similar stock images

stock image Two growing linear 3d illustration graphics showing positive and negative growth and trends with numbers in red-green on blue tech background with motion

Two Growing Linear 3d Illustration Graphics Showing Positive And Negative Growth And Trends With Numbers In Red-green On Blue Tech Background With Motion

5000 × 2813
stock image Stock market candlestick chart rising, stock exchange candles going up, computer monitor, pc display closeup, forex, crypto currency trading uptrend, growth, TA, technical analysis abstract concept

Stock Market Candlestick Chart Rising, Stock Exchange Candles Going Up, Computer Monitor, Pc Display Closeup, Forex, Crypto Currency Trading Uptrend, Growth, TA, Technical Analysis Abstract Concept

5051 × 3111
stock image forex trading graph and candlestick chart suitable for financial investment concept. Economy trends background for business idea and all art work design. Abstract finance background.

Forex Trading Graph And Candlestick Chart Suitable For Financial Investment Concept. Economy Trends Background For Business Idea And All Art Work Design. Abstract Finance Background.

5315 × 3543
stock image Image of financial data processing and stock market over empty office. global business, finances and data processing concept digitally generated image.

Image Of Financial Data Processing And Stock Market Over Empty Office. Global Business, Finances And Data Processing Concept Digitally Generated Image.

4096 × 2160
stock image Stock market digital graph chart business indicator stock exchange trading analysis investment financial on display crisis stock crash down and grow up gain and profits financial impact or forex graph

Stock Market Digital Graph Chart Business Indicator Stock Exchange Trading Analysis Investment Financial On Display Crisis Stock Crash Down And Grow Up Gain And Profits Financial Impact Or Forex Graph

6016 × 4016
stock image 3D rendering of stock indexes in virtual space. Economic growth, recession. Electronic virtual platform showing trends and stock market fluctuations

3D Rendering Of Stock Indexes In Virtual Space. Economic Growth, Recession. Electronic Virtual Platform Showing Trends And Stock Market Fluctuations

3840 × 2160
stock image Annual report of financial statistics, business analytics schedule, monitor screen in perspective

Annual Report Of Financial Statistics, Business Analytics Schedule, Monitor Screen In Perspective

10000 × 5626