Home
Images
Vectors
Videos
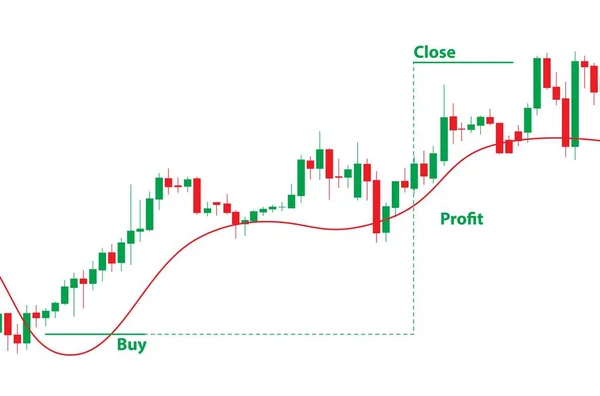
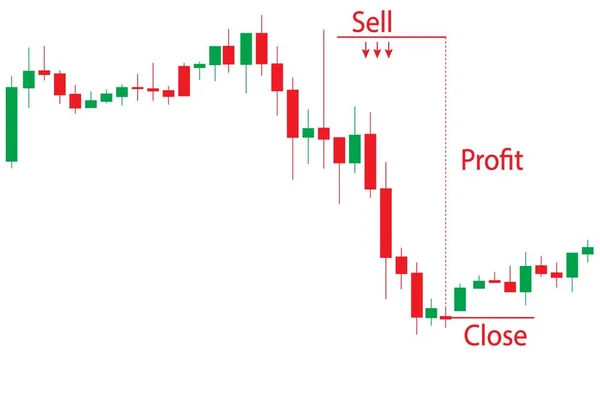
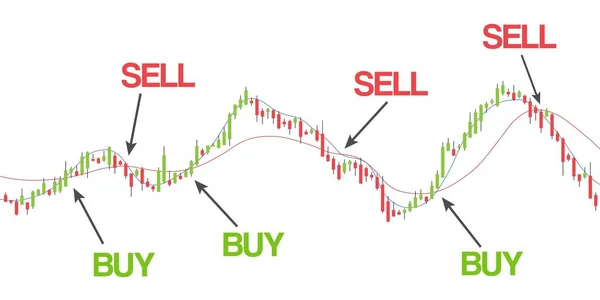
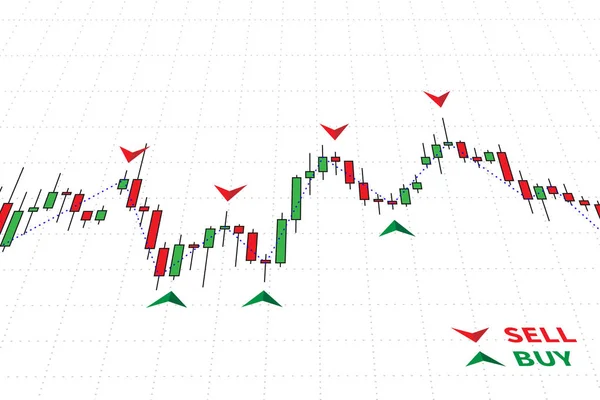
Stock image Japanese candlestick chart
Published:
Jul.18, 2019 13:37:33
Author:
maksim_e
Views:
112
Downloads:
2
File type:
image
/
jpg
File size:
0.81 MB
Orginal size:
6151
x
4065
px
Available sizes:
S
(500 x 330)
M
(1000 x 661)
L
(2000 x 1322)
XL
(6151 x 4065)
EL0
(6151 x 4065)
Level:
beginner
Download Image
Image topics:
Green
Bar
Red
White
Money
Business
Buy
Commercial
Financial
Market
Sign
Growth
Symbol
Concept
Candle
Data
Bank
Banking
Currency
Exchange
Investment
Finance
Stock
Long
Japanese
Foreign
Dollar
Bull
Analysis
Commerce
Graph
Chart
Candlestick
Trade
Broker
Trend
Forex
Trader
Stock Market
Uptrend
Black Background
Stock Exchange
Candlestick Chart
Japanese Candlesticks Charting
Japanese Candlestick Chart
Japanese Chart
Long Trade
Similar stock images
Japanese Candlestick Chart
6151 × 4065
Japanese Candlestick Chart
6151 × 4065
Japanese Candlestick Chart
6151 × 4065
Stock Exchange Vector Chart. Simple Candlestick Trading Graph. Financial Diagram Moving Up And Down With SMA (Simple Moving Average) Line Indicators.
8100 × 4050
Forex Trading Indicators Vector Illustration. Online Trading Signals To Buy And Sell Currency On The Forex Chart Concept. Buy And Sell Indicators For Forex Trade On The Chart Graphic Design.
6250 × 4167
Financial Trade Chart With Uptrend Arrow Vector Illustration. Stock Market Candlestick Graph Webpage Banner. Forex Trading Graphic Design Concept.
9375 × 5273
Forex Trading Indicators Vector Illustration On Black Background
6250 × 4167
Candlestick Chart (also Called Japanese Candlestick Chart) For Forex Trading, Stock Exchange And Crypto Price Analysis.
5700 × 3800