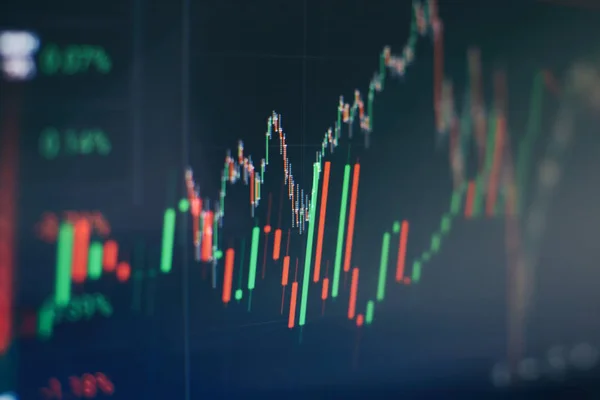
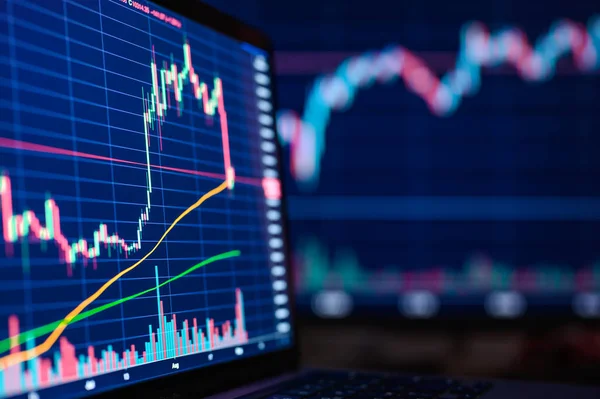
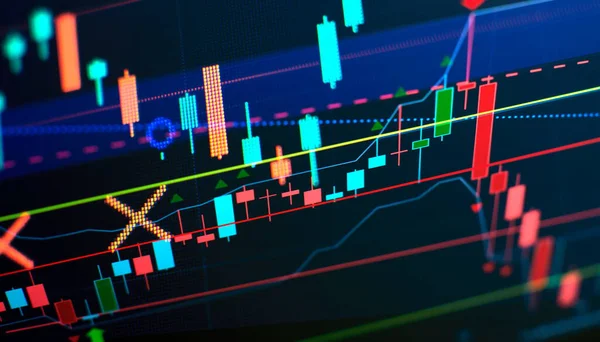
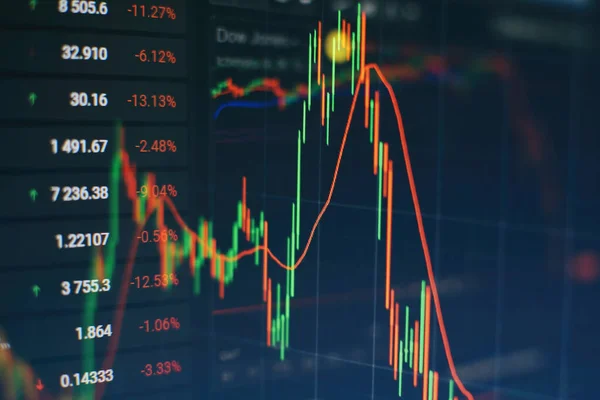
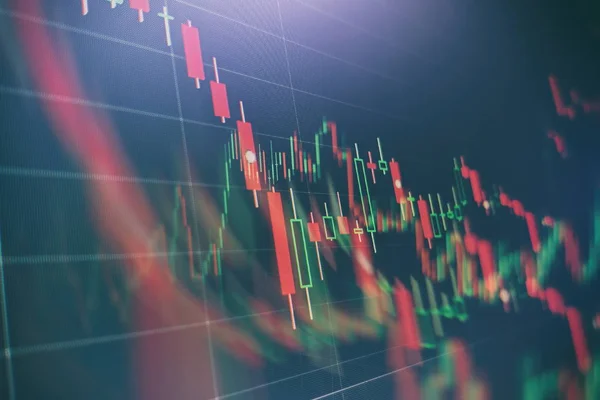
Stock image Laptop screen with stock market charts. Technical analysis and fundamental indicators of stock quotes in the trading terminal. Japanese candlesticks and company tickers.

Published: Feb.01, 2022 15:07:16
Author: Ufalab
Views: 1
Downloads: 0
File type: image / jpg
File size: 5.37 MB
Orginal size: 5000 x 2810 px
Available sizes:
Level: bronze