Home
Images
Vectors
Videos
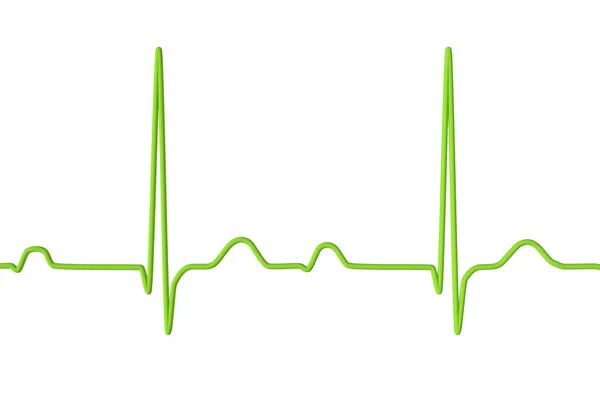
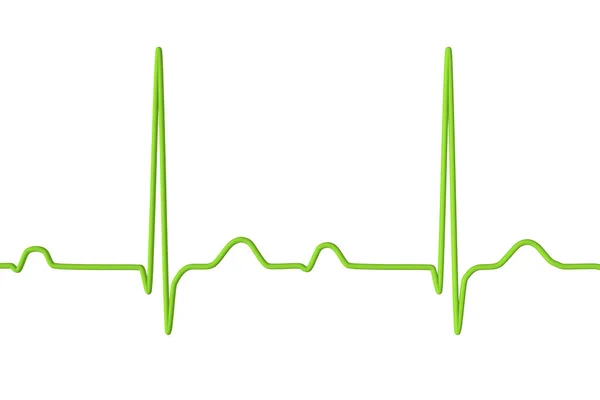
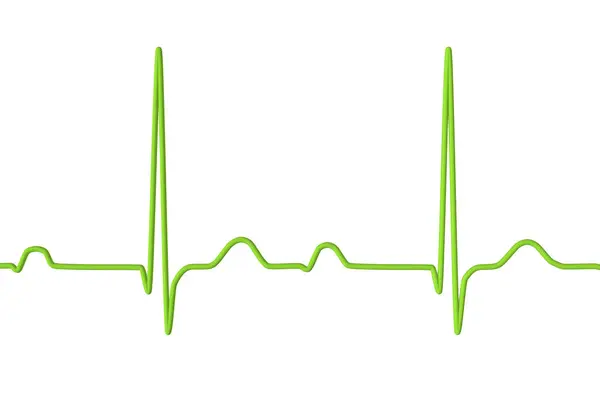
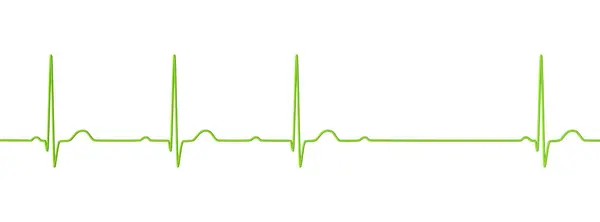
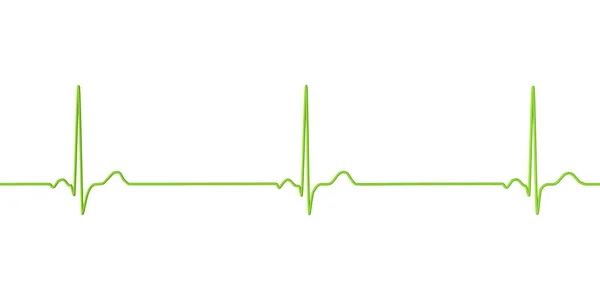
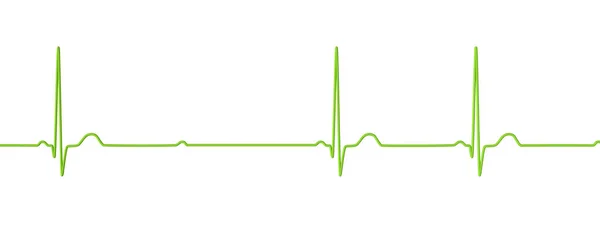
Stock image Long QT syndrome, type 2. 3D illustration of an electrocardiogram (ECG) showing prolonged QT interval with notched and of lower amplitude T-waves.
Published:
Jun.26, 2024 08:50:55
Author:
katerynakon
Views:
0
Downloads:
0
File type:
image
/
jpg
File size:
0.64 MB
Orginal size:
7000
x
2867
px
Available sizes:
S
(500 x 205)
M
(1000 x 410)
L
(2000 x 819)
XL
(7000 x 2867)
EL0
(7000 x 2867)
Level:
silver
Download Image
Image topics:
Illustration
Healthcare
Medical
3d
Cardiology
Heart
Long
Condition
Genetic
Type
Rhythm
Interval
Channels
Calcium
Disorder
Ion
Cardiac
Electrocardiogram
Sodium
Potassium
Syndrome
Ecg
Prolongation
Arrhythmia
Ventricular
White Background
Plain Background
Repolarization
Qt
Long Qt
Similar stock images
3D Illustration Of An ECG Displaying 1st Degree AV Block, A Cardiac Conduction Disorder
7000 × 4667
3D Illustration Of An ECG Displaying 1st Degree AV Block, A Cardiac Conduction Disorder
7000 × 4667
3D Illustration Of An ECG Displaying 1st Degree AV Block, A Cardiac Conduction Disorder
7000 × 4667
3D Illustration Visualizing An ECG With 2nd Degree AV Block (Wenckebach), Highlighting Abnormal Electrical Conduction In The Heart Rhythm.
7000 × 2592
A Detailed 3D Illustration Of An Electrocardiogram Displaying Sinus Bradycardia, A Condition Characterized By A Slow Heart Rate Originating From The Sinus Node, Typically Below 60 Beats Per Minute.
7000 × 3500
3D Illustration Visualizing An ECG With 2nd Degree AV Block (Mobitz 2), Highlighting Abnormal Electrical Conduction In The Heart Rhythm.
7000 × 2800