Home
Images
Vectors
Videos
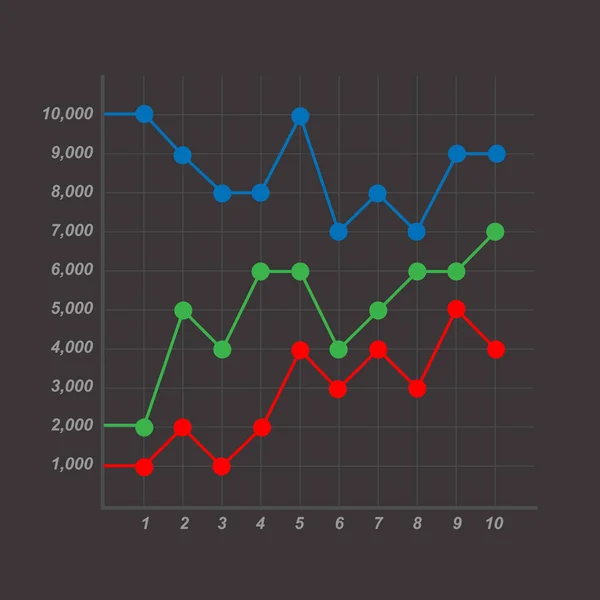
Stock image Multi Line Graph Increasing statistic on blackboard
Published:
Apr.15, 2014 15:39:32
Author:
natanaelginting
Views:
172
Downloads:
1
File type:
image
/
jpg
File size:
3.5 MB
Orginal size:
5250
x
3153
px
Available sizes:
S
(500 x 300)
M
(1000 x 601)
L
(2000 x 1201)
XL
(5250 x 3153)
EL0
(5250 x 3153)
Level:
bronze
Download Image
Image topics:
Green
Red
White
Background
Money
Graphic
Multi
Business
Financial
Success
Growth
Board
Line
Arrow
Motion
Corporate
Drawing
Help
Bank
Banking
Cash
Currency
Investment
Finance
Economy
Sketch
Company
Goal
Improvement
Growing
Analysis
Graph
Chart
Economic
Animation
Cooperation
Accounting
Blackboard
Diagram
Chalk
Allowance
Increase
Statistic
Earning
Integration
Cashflow
Analysing
Fluctuate
Stop Motion
Multi Line
Similar stock images
Stock Price Chart On The Notebook Page. Growth And Decline Dynamics. Creative Financial Concept. Investment Background.
3840 × 2160
Bar Graph
2550 × 2496
Mixed Chart Chalk Icon. Vertical Histogram With Linear Elements.
5000 × 5000
Web
4000 × 4000
Icon Statistics Vector Illustration
5906 × 4331
Graphs Computer Symbol
5000 × 5000
Business Graph
3000 × 3000
Overheating Of The Stock Market And Falling Concept.
6727 × 4037