photo free
Home Images Vectors Videos

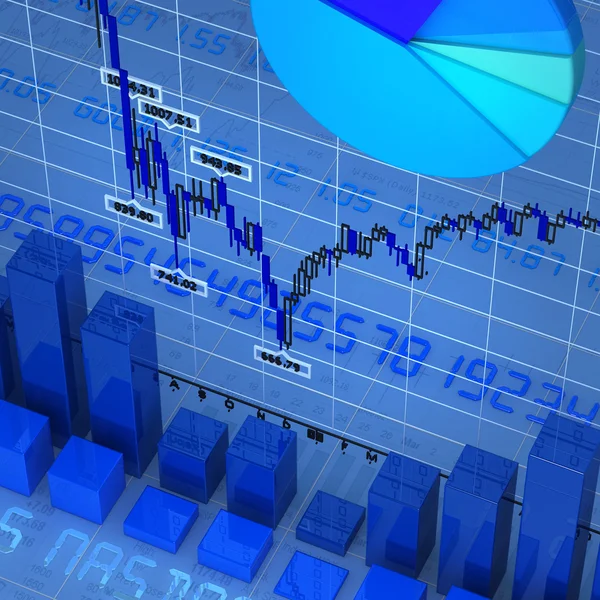
Stock image Orange charts

Stock image Orange charts
Published: May.21, 2013 12:51:04
Author: imagewell
Views: 59
Downloads: 1
File type: image / jpg
File size: 12.27 MB
Orginal size: 6000 x 6000 px
Available sizes:
S
(500 x 500)
M
(1000 x 1000)
L
(2000 x 2000)
XL
(6000 x 6000)
EL0
(6000 x 6000)
Level: bronze
Download Image
Image topics:

Similar stock images

stock image Blue charts

Blue Charts

6000 × 6000
stock image Measuring of market sentiment

Measuring Of Market Sentiment

6000 × 3600
stock image The digital indicators and declining graphs of a stock market crash overlap the backdrop of a modernistic city. Concept of a market crash in double exposure.

The Digital Indicators And Declining Graphs Of A Stock Market Crash Overlap The Backdrop Of A Modernistic City. Concept Of A Market Crash In Double Exposure.

3109 × 1961
stock image Business candle stick graph chart of stock market investment trading on Cityscape background

Business Candle Stick Graph Chart Of Stock Market Investment Trading On Cityscape Background

4200 × 2800
stock image Candlestick graph chart with digital data, uptrend or down trend

Candlestick Graph Chart With Digital Data, Uptrend Or Down Trend

8000 × 4500
stock image Business candle stick graph chart of stock market, 3d rendering

Business Candle Stick Graph Chart Of Stock Market, 3d Rendering

10000 × 6000
stock image Stock market or forex trading business graph chart for financial investment concept. Business presentation for your design and text. Economy trends, business idea and technology innovation design.

Stock Market Or Forex Trading Business Graph Chart For Financial Investment Concept. Business Presentation For Your Design And Text. Economy Trends, Business Idea And Technology Innovation Design.

5906 × 3322
stock image finance stock currency volume profile trading banner

Finance Stock Currency Volume Profile Trading Banner

5000 × 2200