Home
Images
Vectors
Videos
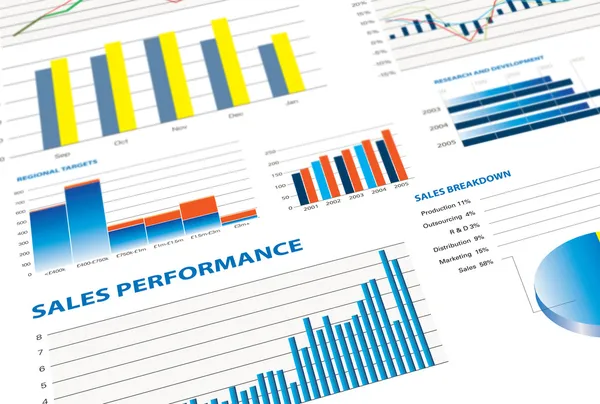
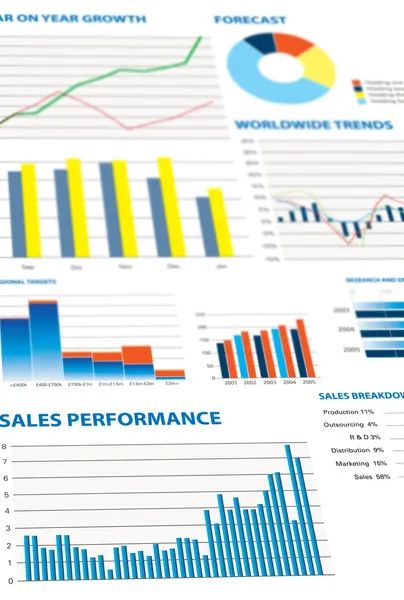
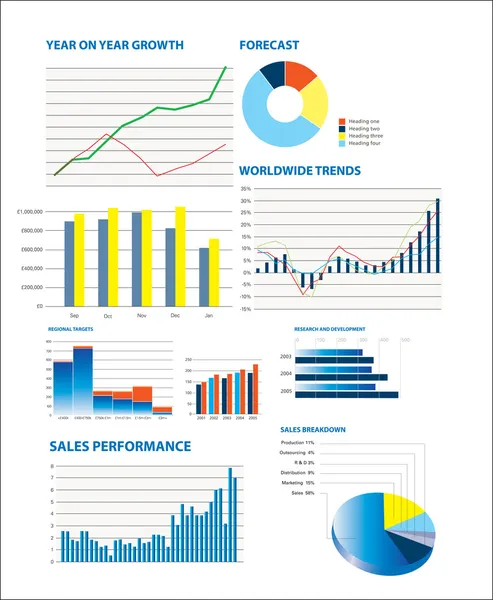
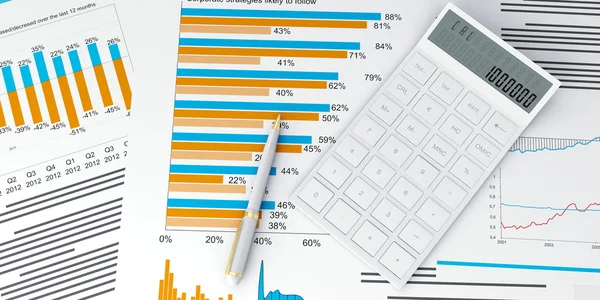
Stock image Sales performance and business graphs
Published:
May.19, 2010 12:27:46
Author:
Joingate
Views:
2819
Downloads:
184
File type:
image
/
jpg
File size:
2.95 MB
Orginal size:
4900
x
3300
px
Available sizes:
S
(500 x 337)
M
(1000 x 673)
L
(2000 x 1347)
XL
(4900 x 3300)
EL0
(4900 x 3300)
Level:
silver
Download Image
Image topics:
Numbers
Bar
Background
Nobody
Graphic
Close Up
Illustration
Wealth
Business
Financial
Growth
Up
Close
Pie
Line
Fingers
Manager
Data
Measure
Performance
Looking
Investment
Future
Strategy
Plan
Report
Sales
Improve
Analysis
Graph
Chart
Coloured
Economic
Selection
Of
Progress
Diagram
Looks
A
Reports
Powerpoint
Breakdown
And
Ladies
De
As
Charts
Graphs
Analyse
Reporting
Similar stock images
Selection Of Financial And Economic Grap
4900 × 3300
Selection Of Financial And Economic Grap
3300 × 4900
Selection Of Fictional Graphs
3402 × 4137
3d Illustration Of A Business, Finance Credit Reports And Statis
3000 × 1500
3d Illustration: Drawing From The Sale Of Stock Exchanges, Busin
3000 × 1500
Financial Business Charts
7360 × 4912
Financial Analysis With Charts.
4288 × 2848
Graphs, Charts, Business Table. The Workplace Of Business
3264 × 3264