photo free
Home Images Vectors Videos

Stock image Shallow depth of field (selective focus) with details of a candlestick chart on a computer screen.
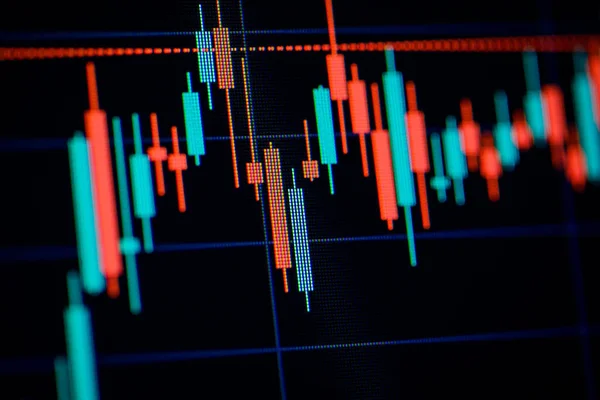
Stock image Shallow depth of field (selective focus) with details of a candlestick chart on a computer screen.
Published: Apr.26, 2021 09:51:17
Author: Mircea Moira
Views: 0
Downloads: 0
File type: image / jpg
File size: 10.99 MB
Orginal size: 6720 x 4480 px
Available sizes:
S
(500 x 333)
M
(1000 x 667)
L
(2000 x 1333)
XL
(6720 x 4480)
EL0
(6720 x 4480)
Level: bronze
Download Image
Image topics:

Similar stock images

stock image Shallow depth of field (selective focus) with details of a candlestick chart on a computer screen.

Shallow Depth Of Field (selective Focus) With Details Of A Candlestick Chart On A Computer Screen.

6720 × 4480
stock image Bar graphs, Diagrams, financial figures. Forex chart. Abstract glowing forex chart interface wallpaper. Investment, trade, stock, finance and analysis concept.

Bar Graphs, Diagrams, Financial Figures. Forex Chart. Abstract Glowing Forex Chart Interface Wallpaper. Investment, Trade, Stock, Finance And Analysis Concept.

5472 × 3648
stock image Stock trading, crypto currency background.Charts of financial instruments

Stock Trading, Crypto Currency Background.Charts Of Financial Instruments

9803 × 4488
stock image Shallow depth of field (selective focus) with details of a candlestick chart on a computer screen.

Shallow Depth Of Field (selective Focus) With Details Of A Candlestick Chart On A Computer Screen.

6720 × 4480
stock image Tilted Red and Green Stock Chart or Forex Chart and Table Line on Black Background in Green Tone

Tilted Red And Green Stock Chart Or Forex Chart And Table Line On Black Background In Green Tone

6959 × 4553
stock image Stock market graph trading analysis investment financial, stock exchange financial or forex graph stock market graph chart business crisis crash and grow up gain and profits

Stock Market Graph Trading Analysis Investment Financial, Stock Exchange Financial Or Forex Graph Stock Market Graph Chart Business Crisis Crash And Grow Up Gain And Profits

6016 × 4016
stock image Charts of financial instruments with various type of indicators including volume analysis for professional technical analysis on the monitor of a computer.

Charts Of Financial Instruments With Various Type Of Indicators Including Volume Analysis For Professional Technical Analysis On The Monitor Of A Computer.

8268 × 4724
stock image Candle stick graph chart of stock market investment trading, Stock exchange concept design and background.

Candle Stick Graph Chart Of Stock Market Investment Trading, Stock Exchange Concept Design And Background.

5315 × 3543