photo free
Home Images Vectors Videos

Stock image Spirometry Curve analyses. Illustration of spirometry curves.

Stock image Spirometry Curve analyses. Illustration of spirometry curves.
Published: Sep.20, 2021 15:31:46
Author: jenifferfontan@gmail.com
Views: 1
Downloads: 0
File type: image / jpg
File size: 1.9 MB
Orginal size: 7553 x 3486 px
Available sizes:
S
(500 x 231)
M
(1000 x 462)
L
(2000 x 923)
XL
(7553 x 3486)
EL0
(7553 x 3486)
Level: beginner
Download Image
Image topics:

Similar stock images

stock image Spirometry Curve analyses. Illustration of spirometry curves.

Spirometry Curve Analyses. Illustration Of Spirometry Curves.

8352 × 4320
stock image Illustration of ECG interpretation. ECG of a healthy person. Useful for educating doctors and nurses.

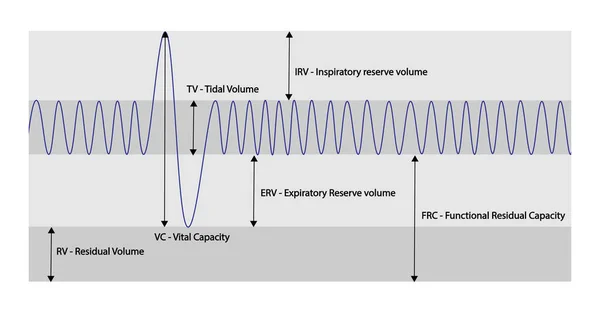
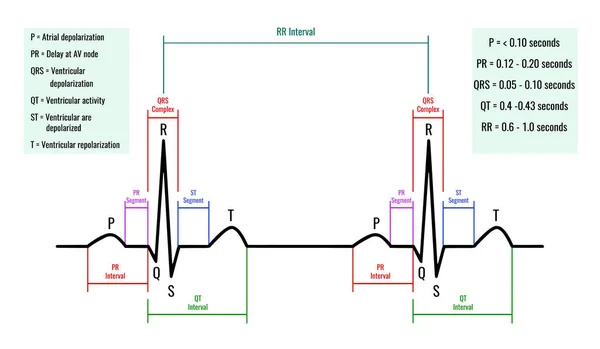
Illustration Of ECG Interpretation. ECG Of A Healthy Person. Useful For Educating Doctors And Nurses.

7087 × 4134
stock image Left ventricular pressure-volume (PV) loops, electrocardiogram (ECG) and Phonocardiogram curves

Left Ventricular Pressure-volume (PV) Loops, Electrocardiogram (ECG) And Phonocardiogram Curves

10048 × 9433
stock image Ventricular flutter is a fatal ventricular tachyarrhythmia, which resembles a sine wave after squeezing, and cannot distinguish between QRS waves and T waves.

Ventricular Flutter Is A Fatal Ventricular Tachyarrhythmia, Which Resembles A Sine Wave After Squeezing, And Cannot Distinguish Between QRS Waves And T Waves.

10000 × 10878
stock image When the two coronary arteries are occluded at the same time, the ST segment elevation of the ischemic myocardium on one side is countered by the corresponding ST segment depression on the other side.

When The Two Coronary Arteries Are Occluded At The Same Time, The ST Segment Elevation Of The Ischemic Myocardium On One Side Is Countered By The Corresponding ST Segment Depression On The Other Side.

9000 × 15938
stock vector Process of Partially filled band, Conductors, Insulator, Semiconductor

Process Of Partially Filled Band, Conductors, Insulator, Semiconductor

5209 × 3542
stock image When 1mV voltage is input to different ECG calibration voltage, the amplitude of ECG deflection is different. This is an important parameter for analyzing ECG amplitude.

When 1mV Voltage Is Input To Different ECG Calibration Voltage, The Amplitude Of ECG Deflection Is Different. This Is An Important Parameter For Analyzing ECG Amplitude.

6000 × 7739
stock image The negative part of P wave in lead V1 carries the electrical information of the left atrium, and the increase of amplitude and duration indicates that the left atrium is diseased.

The Negative Part Of P Wave In Lead V1 Carries The Electrical Information Of The Left Atrium, And The Increase Of Amplitude And Duration Indicates That The Left Atrium Is Diseased.

10000 × 5445