photo free
Home Images Vectors Videos

Stock image stock chart fall down high drop for economic downturn global recession crisis
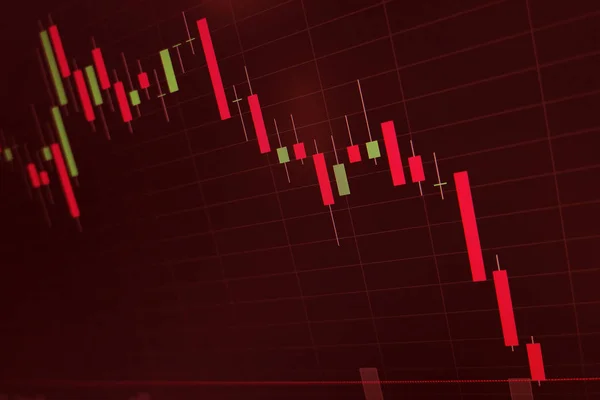
Stock image stock chart fall down high drop for economic downturn global recession crisis
Published: Oct.10, 2019 14:44:57
Author: coffeekai
Views: 4
Downloads: 1
File type: image / jpg
File size: 4.53 MB
Orginal size: 5472 x 3648 px
Available sizes:
S
(500 x 333)
M
(1000 x 667)
L
(2000 x 1333)
XL
(5472 x 3648)
EL0
(5472 x 3648)
Level: bronze
Download Image
Image topics:

Similar stock images

stock image Daily trading prices on the online stock market graph showing on purple screen.Daily investor's business everyday life.Banner,selective focus.

Daily Trading Prices On The Online Stock Market Graph Showing On Purple Screen.Daily Investor's Business Everyday Life.Banner,selective Focus.

6016 × 2662
stock image Forex concept : Candlestick chart red green in financial market

Forex Concept : Candlestick Chart Red Green In Financial Market

5384 × 3590
stock image Daily trading prices stock market graph showing on the screen.Daily investor's business everyday life.Selective focus.

Daily Trading Prices Stock Market Graph Showing On The Screen.Daily Investor's Business Everyday Life.Selective Focus.

3000 × 2003
stock image Economic graph with diagrams on the stock market, for business and financial concepts and reports.Abstract blue background.

Economic Graph With Diagrams On The Stock Market, For Business And Financial Concepts And Reports.Abstract Blue Background.

5315 × 3543
stock image Business candle stick graph chart of stock market

Business Candle Stick Graph Chart Of Stock Market

5888 × 3392
stock image Financial diagram with candlestick chart used in market analysis for variation report of share price

Financial Diagram With Candlestick Chart Used In Market Analysis For Variation Report Of Share Price

8858 × 4724
stock image Bitcoin price drop. The volatility of the cryptocurrency concept. Candle chart of the rise and fall of prices

Bitcoin Price Drop. The Volatility Of The Cryptocurrency Concept. Candle Chart Of The Rise And Fall Of Prices

3428 × 2285
stock image Business candle stick graph chart of stock market

Business Candle Stick Graph Chart Of Stock Market

6000 × 3710