Home
Images
Vectors
Videos
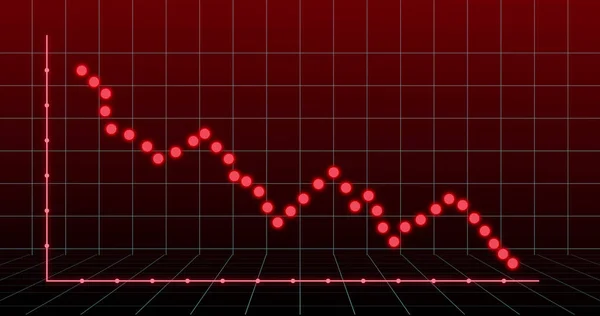
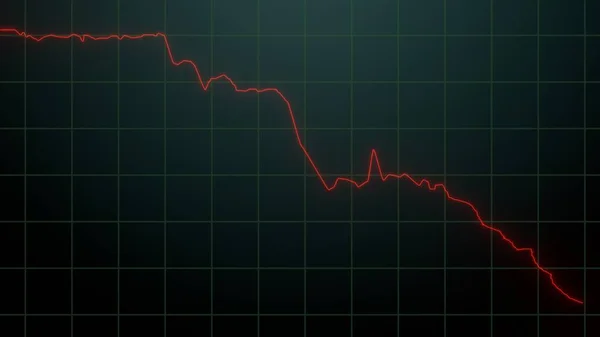
Stock image Stock chart going down. Share price illustration. Investment concept.
Published:
Jan.27, 2022 14:34:24
Author:
senodenimous@gmail.com
Views:
1
Downloads:
0
File type:
image
/
jpg
File size:
2.13 MB
Orginal size:
3840
x
2160
px
Available sizes:
S
(500 x 281)
M
(1000 x 563)
L
(2000 x 1125)
XL
(3840 x 2160)
EL0
(3840 x 2160)
Level:
beginner
Download Image
Image topics:
Red
Graphic
Design
Business
Financial
Market
Rate
Trading
Risk
Arrow
Price
Digital
Global
Data
Information
Down
Currency
Exchange
Investment
Finance
Invest
Stock
Crisis
Economy
Strategy
Forecast
Report
Positive
Falling
Failure
Index
Analysis
Commerce
Graph
Value
Chart
Economic
Profit
Indicator
Fail
Panic
Broker
Investor
Loser
Decrease
Stocks
Trader
3d Render
Stock Market
Break Down
Similar stock images
Image Of Financial Graph Over Red Background. Math, Statistics, Finance, Economy And Technology Concept Digitally Generated Image.
4096 × 2160
Constantly Changing Flickering Stock Graph, Creative Infographics Animation. Data Visualization. Forex Trade Graph.
7680 × 4320
Audio Waveform Monitor Macro Shot
1920 × 1080
Constantly Changing Flickering Stock Graph, Creative Infographics Animation. Data Visualization. Forex Trade Graph.
7680 × 4320
Graph Of Different Levels Of Frequency In A Room
1920 × 1080
Constantly Changing Flickering Stock Graph, Creative Infographics Animation. Data Visualization. Forex Trade Graph.
7680 × 4320
Image Of Financial Graph Over Red Background. Math, Statistics, Finance, Economy And Technology Concept Digitally Generated Image.
4096 × 2160
Business Chart, Stock Market Forex Trading Graph Going Up Animation
7680 × 4320