photo free
Home Images Vectors Videos

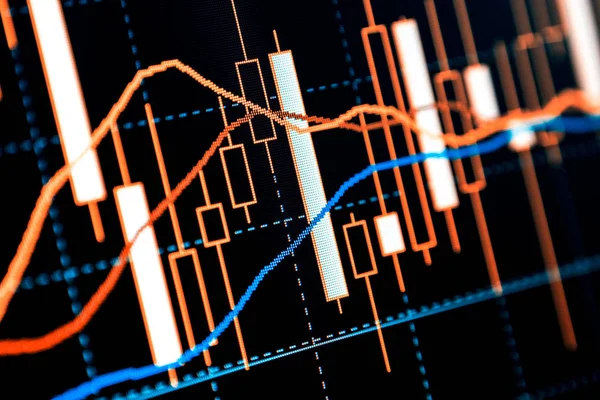
Stock image Stock crash market exchange loss trading graph analysis investment indicator business graph charts of financial digital background arrow down stock crisis red price in down trend chart fall 3d render

Stock image Stock crash market exchange loss trading graph analysis investment indicator business graph charts of financial digital background arrow down stock crisis red price in down trend chart fall 3d render
Published: May.06, 2020 07:29:01
Author: LukVFX
Views: 11
Downloads: 0
File type: image / jpg
File size: 3.17 MB
Orginal size: 3840 x 2160 px
Available sizes:
S
(500 x 281)
M
(1000 x 563)
L
(2000 x 1125)
XL
(3840 x 2160)
EL0
(3840 x 2160)
Level: beginner
Download Image
Image topics:

Similar stock images

stock image Daily trading prices stock market graph showing on the screen.Daily investor's business everyday life.Selective focus.

Daily Trading Prices Stock Market Graph Showing On The Screen.Daily Investor's Business Everyday Life.Selective Focus.

6016 × 4016
stock image 3D rendering of stock indexes in virtual space. Economic growth, recession. Electronic virtual platform showing trends and stock market fluctuations

3D Rendering Of Stock Indexes In Virtual Space. Economic Growth, Recession. Electronic Virtual Platform Showing Trends And Stock Market Fluctuations

3840 × 2160
stock image Stock market indicator and financial data view from LED. Double

Stock Market Indicator And Financial Data View From LED. Double

5184 × 3456
stock image Charts of financial instruments with various type of indicators including volume analysis for professional technical analysis on the monitor of a computer.

Charts Of Financial Instruments With Various Type Of Indicators Including Volume Analysis For Professional Technical Analysis On The Monitor Of A Computer.

8268 × 4724
stock image Financial background blue

Financial Background Blue

6000 × 4000
stock image Abstract business graph of growing figures statistics stock Of companies

Abstract Business Graph Of Growing Figures Statistics Stock Of Companies

5500 × 3050
stock image The price chart Japanese candle stick charts

The Price Chart Japanese Candle Stick Charts

7360 × 4912
stock image Image of statistics and financial data processing on blue background. global business, finances and digital interface concept digitally generated image.

Image Of Statistics And Financial Data Processing On Blue Background. Global Business, Finances And Digital Interface Concept Digitally Generated Image.

4096 × 2160