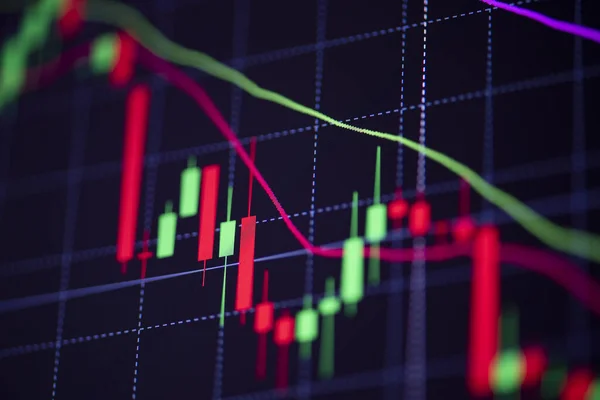
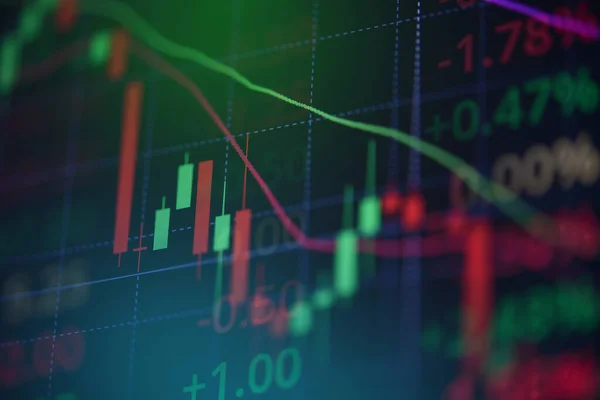
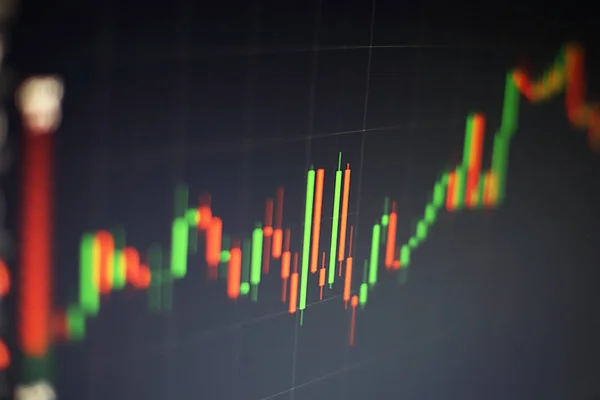
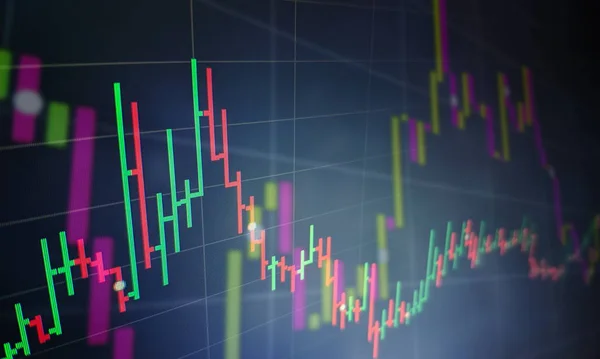
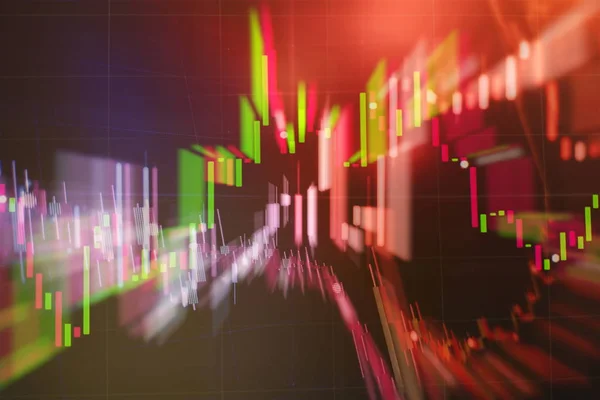
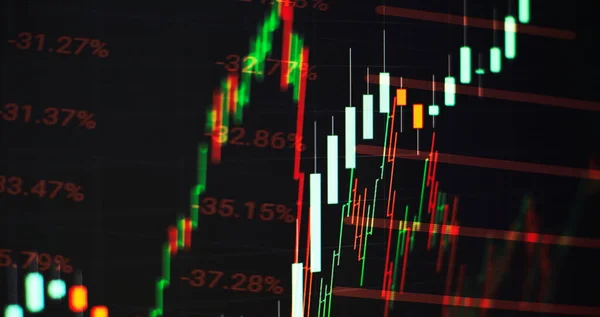
Stock image Stock graph charts on the stock market exchange price with investment of business financial digital background / Candle stick stock or forex trading indicator on computer monitor for investors

Published: Apr.29, 2020 11:59:23
Author: poringdown@gmail.com
Views: 3
Downloads: 0
File type: image / jpg
File size: 7.82 MB
Orginal size: 6016 x 4016 px
Available sizes:
Level: bronze