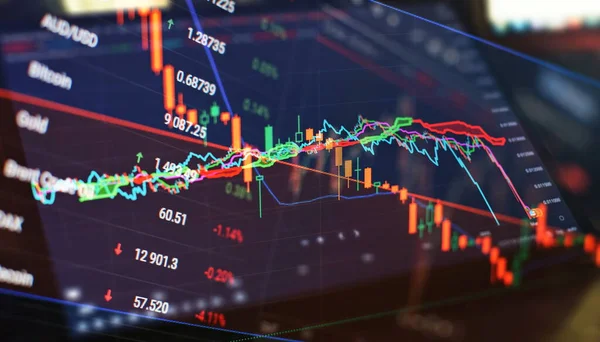
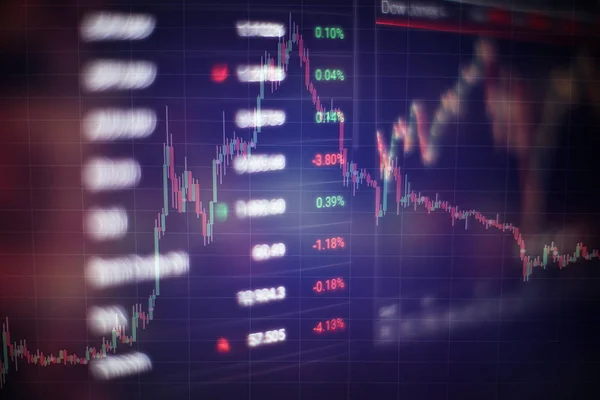
Stock image Stock index on the computer monitor . Financial data on a monitor which including of Market Analyze. Bar graphs, Diagrams, financial figures.
Published: Mar.02, 2020 15:39:10
Author: Maximusdn
Views: 23
Downloads: 6
File type: image / jpg
File size: 5.87 MB
Orginal size: 5472 x 3648 px
Available sizes:
Level: bronze
Similar stock images


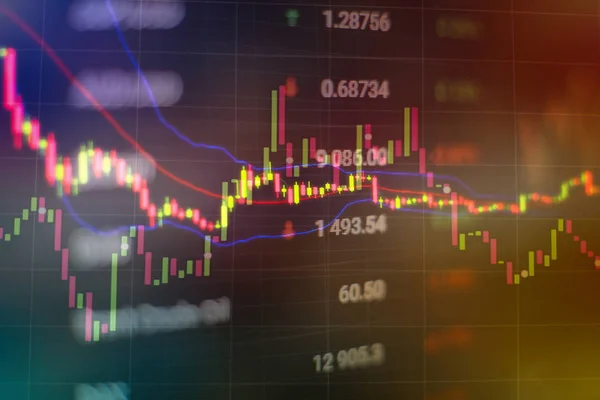


Financial Data On A Monitor Which Including Of Market Analyze. Bar Graphs, Diagrams, Financial Figures.
5315 × 3543