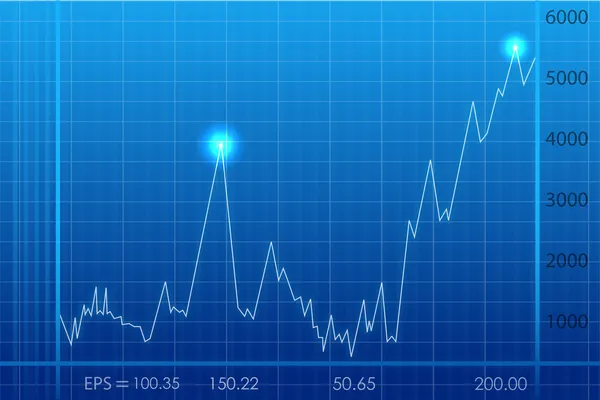
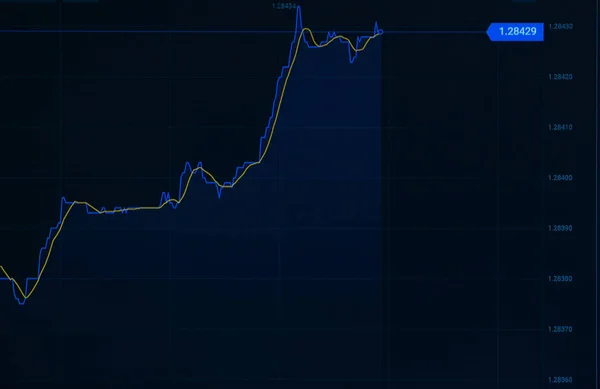
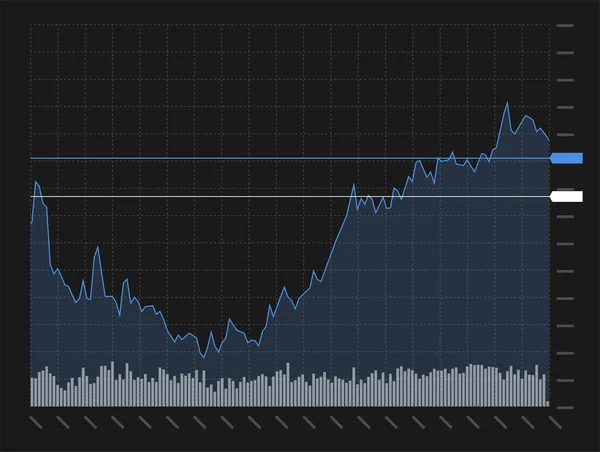
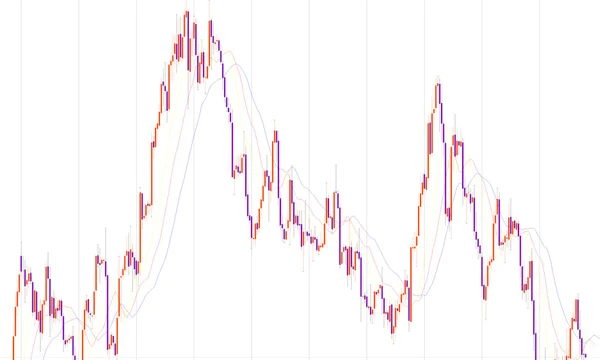
Stock image Stock market chart moving up and down. Trading screen with chart and line, analyzing equity chart. Busines, stock market and exchange, graph and investment.
Published: May.15, 2023 12:52:20
Author: Westlight
Views: 0
Downloads: 0
File type: image / jpg
File size: 5.63 MB
Orginal size: 7000 x 3500 px
Available sizes:
Level: beginner